
Most RevOps teams build dashboards for operators: daily call volume, stage conversion rates, rep activity logs. Those metrics matter inside the business. They help managers coach reps and help marketing adjust campaigns.
But when the same charts show up in a board meeting, something uncomfortable happens. Investors stop asking about growth and start asking what they’re missing.
The issue isn’t that the numbers are wrong. It’s that they answer the wrong question.
Operational dashboards answer: “Is the team executing today?”
Board metrics answer: “Is this company becoming more valuable over time, and is growth durable?”
When those get mixed, the meeting shifts. Instead of discussing expansion plans, leadership spends 20 minutes explaining how MQL conversion relates to revenue quality. The CFO translates the pipeline into cash impact. The CEO manually reframes CAC. Confidence drops not because performance is poor, but because clarity is missing.
That moment is expensive. Boards make capital allocation decisions in those conversations. Whether to accelerate hiring, protect runway, or prepare for a raise depends on signals they can interpret instantly. If RevOps presents activity instead of trajectory, leadership unintentionally creates doubt at the exact point they need conviction.
A board member holding equity across a dozen companies won’t reverse-engineer your CAC from funnel charts. They’re scanning for three things: scalability, capital efficiency, and competitive durability. Each metric needs to communicate that in under a minute with visible trend context.
Rule of thumb: If a metric doesn't change the capital allocation conversation, it belongs in the appendix, not the headline.
The Core Five: What to Measure and Why It Matters
1. Net Revenue Retention (NRR)
NRR measures the revenue retained from your existing customer base over a period, including expansion and offset by churn and contraction. It's the single most powerful signal of product-market fit and long-term unit economics.
Formula: NRR = (Beginning MRR + Expansion MRR − Churned MRR − Contraction MRR) ÷ Beginning MRR × 100
Example: If you start a quarter with $2M in MRR, expand by $300K, lose $150K to churn, and see $50K in downgrades, your NRR is (2,000,000 + 300,000 − 150,000 − 50,000) ÷ 2,000,000 × 100 = 105%. This means your existing customer base grew by 5% without a single new logo.
From an investor perspective, NRR above 100% means new sales are purely additive, the base compounds. At 110% NRR, a company with $10M ARR would theoretically reach $25.9M ARR in five years from existing customers alone. That changes the growth story and the capital required to achieve it.
Common calculation errors: Teams often exclude seats-based expansion or count reactivations as new ARR. They also miscalculate contraction by using invoiced amounts rather than recognized revenue. In a sales and operations planning context, the data source for NRR must be reconciled with finance, using CRM-only data typically overstates NRR by 3-8 percentage points.
2. CAC Payback Period
CAC Payback measures how many months it takes to recover the cost of acquiring a customer through their gross margin contribution. It's a capital efficiency metric that directly impacts how much you need to fundraise and at what cadence.
Formula: CAC Payback = Fully-loaded CAC ÷ (ACV × Gross Margin %), expressed in months.
Example: If it costs $18,000 fully-loaded (sales + marketing + onboarding) to close a customer paying $24,000 ACV, and your gross margin is 75%, your monthly gross margin contribution is $1,500. Payback = 18,000 ÷ 1,500 = 12 months. Every dollar spent on sales generates a return within one year.
Investors use this metric to stress-test your burn. A 24-month payback period means you're tying up working capital for two years per customer before a dollar of real profit. At scale, this creates a liquidity crunch regardless of revenue growth.
Common mistake: Many sales operations service teams calculate CAC using only direct sales headcount costs and ignore marketing attribution, SE time, implementation cost, and SDR overhead. This understates true CAC by 30–50% and presents a misleading picture to the board.
3. Sales Efficiency (Magic Number)
The Magic Number quantifies revenue generated per dollar of sales and marketing spend. It's a scalability test. Does adding spend produce proportional revenue?
Formula: Magic Number = (Current Quarter Net New ARR − Prior Quarter Net New ARR) × 4 ÷ Prior Quarter S&M Spend
Example: If Q2 net new ARR is $1.2M, Q1 was $900K, and Q1 S&M spend was $1.6M, Magic Number = (1,200,000 − 900,000) × 4 ÷ 1,600,000 = 0.75. A score above 0.75 suggests it's worth increasing spend. Above 1.0 means every dollar in generates more than a dollar of annualized return.
This metric answers the board's most common strategic question: should we press the gas or tighten the belt? A declining Magic Number over three quarters is an early warning sign of market saturation, competitive pressure, or ICP drift — well before revenue growth actually stalls.
Common mistake: Including professional services revenue in net new ARR inflates the numerator and masks weak software sales productivity. Conversely, excluding customer success spend from S&M understates the denominator.
4. Pipeline Coverage by Segment
Pipeline coverage measures the ratio of qualified pipeline to quota for a defined period, broken down by segment (enterprise, mid-market, SMB). It's a forward-looking risk indicator, not a backward-looking performance metric.
Formula: Coverage Ratio = Total Qualified Pipeline ÷ Quota for the Period
Example: If Q4 enterprise quota is $4M and qualified enterprise pipeline sits at $13M, coverage is 3.25x. This implies roughly 30% win rate to make the number, reasonable for complex enterprise deals. If mid-market shows only 1.8x coverage with a historical win rate of 35%, that's a near-term miss signal.
Boards care about this segmented because blended coverage masks risk distribution. A company with $30M in total pipeline against $10M quota looks healthy at 3x, until you realize that $22M is in enterprise with a 6-month sales cycle and the quarter closes in 45 days.
For the sales and operations analyst building this view, the critical discipline is using stage-weighted or stage-gated pipeline, not raw CRM totals. Including stage-1 discovery calls in coverage math is one of the most common and costly distortions in board reporting.
5. Win Rate Trends by Deal Size
Win rate, competitive win rate in particular, tells the board whether the product is winning in the market, and whether it wins differently at different price points. Trend is everything here; a single-quarter win rate is nearly meaningless without context.
Formula: Win Rate = Closed Won Opportunities ÷ (Closed Won + Closed Lost) × 100, segmented by deal size band (<$25K, $25–$100K, >$100K ACV).
Example: If the win rate in the $25–$100K band dropped from 38% to 27% over three consecutive quarters, that's not noise, that's a structural signal. It could mean a competitor sharpened their mid-market offering, your pricing drifted out of buyer range, or ICP targeting shifted without aligned enablement.
The reason deal-size segmentation matters to investors: a business winning large deals at 22% but losing mid-market at 18% has a very different risk profile than the reverse. High-ACV concentration amplifies both upside and downside volatility, important context for a board evaluating growth durability.
Common mistake: Including no-decision outcomes in the denominator. When a prospect goes dark or freezes budget, that's not a competitive loss. Mixing them distorts the competitive signal and obscures real win/loss intelligence.
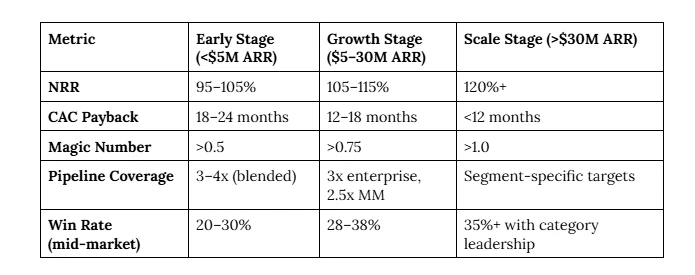
Benchmarking Context: What 'Good' Looks Like
Benchmarks without context are misleading. A 90% NRR is excellent for a $500K ACV enterprise business and mediocre for a $3K ACV SMB SaaS product where churn is structural. Boards with cross-portfolio experience know this, which is why context matters as much as the number itself.
Business models shape benchmarks significantly. A usage-based SaaS company will naturally show lower initial NRR than a seat-based contract business because expansion is non-linear. A PLG (product-led growth) motion compresses CAC payback but widens win rate variance. Presenting metrics without this framing invites board members to apply the wrong benchmark, often from a portfolio company in a different segment entirely.
Segment also matters within your own business. If 60% of ARR comes from enterprise, your overall CAC payback will look worse than a pure SMB peer, even if your unit economics are structurally superior. Skilled sales and operations planning separates these dynamics so the board can evaluate each motion on its own merits.
Presentation Cadence and Narrative Discipline
Boards typically meet quarterly, but that doesn't mean all five metrics should receive equal airtime every quarter. A practical sales operations service model uses a tiered cadence:
- Every board meeting: NRR trend (trailing 4 quarters), Magic Number, and Pipeline Coverage by segment.
- Quarterly with expanded narrative: CAC Payback updated with any methodology changes noted; Win Rate trends with competitive commentary.
- Annual deep-dive: Cohort-level NRR, multi-year win rate by segment, CAC by channel and ICP.
Trend lines matter infinitely more than point-in-time snapshots. A board seeing NRR of 108% for the first time has no frame of reference. A board seeing NRR track from 102% → 105% → 108% across three quarters understands that the retention engine is strengthening, and can ask informed questions about what drove it.
Narrative structure should follow: state the number, state the trend, identify the driver, name the risk or implication. Example: "CAC Payback improved from 16 to 13 months this quarter. This reflects improved SDR-to-AE handoff efficiency and a 12% reduction in average sales cycle. The risk is that our current pipeline mix skews toward enterprise, where payback will re-lengthen to 20+ months. We are monitoring this through Q3."
Boards don't want raw data. They want a confident operator who understands what the numbers mean and what decisions they imply.
Tiering Supplemental Metrics Without Diluting Focus
There are dozens of metrics a mature sales operations analyst team can produce, average contract value trends, ramp-to-quota ratios, forecast accuracy, SDR pipeline contribution, and churn by customer segment. These are not irrelevant. But placing them alongside the core five in a board deck creates cognitive overload and signals that the team doesn't know what matters most.
A clean tiering approach:
- Tier 1: Board Headline (core five): Presented on the main board slides with trend charts and brief narrative. No more than one slide per metric.
- Tier 2: Supplemental Context: Included in a clearly labeled appendix. Metrics like forecast accuracy, SDR-sourced pipeline %, and ACV trend by segment belong here. Board members who want depth can find it; those who don't won't be distracted.
- Tier 3: Operational Metrics: Live in your internal dashboards. Activity metrics, rep attainment distributions, funnel stage conversion rates. These answer operational questions, not capital questions.
One practical rule: if a supplemental metric doesn't directly explain a movement in one of the core five, it belongs in Tier 3. For example, if SDR-sourced pipeline drops 20% quarter-over-quarter, that's context for a declining Magic Number, it belongs in Tier 2 as a supporting explanation, not as a standalone board metric.
The discipline of tiering also protects the sales and operations analyst team from the endless' can you add X to the board deck' requests that accumulate over time. A documented framework for what belongs at each tier gives RevOps the structure to say no, and the rationale to explain why.
Conclusion
Board metrics are not a reporting exercise. They're a credibility signal. When a RevOps team walks into a board meeting with five tightly defined, correctly calculated, trend-contextualized metrics and a clear narrative around each, they demonstrate that the company understands its own business. That confidence compounds into investor trust, which ultimately shapes how your company gets valued, funded, and supported through hard quarters.
The work of sales and operations planning at board level isn't about building the most comprehensive dashboard. It's about ruthlessly prioritizing the signal over the noise, and presenting it with the clarity that decisions require.