Crypto traders don't have a shortage of data.
They have the opposite problem.
There are charts, exchange flows, wallet movements, funding rates, social sentiment, news updates, liquidity data, and thousands of new market signals appearing every day.
The difficult part isn't finding information.
It's knowing what to do with it.
A trader can have access to hundreds of metrics and still make poor decisions if those metrics are viewed in isolation. A sudden whale transfer might look bearish. A breakout might look bullish. Positive sentiment might suggest momentum is building.
But none of these tells the complete story by itself.
The real advantage comes from turning raw market data into context, a trading thesis, and a clearly defined decision.
Data Is Not the Same as Insight
Consider a simple example.
Bitcoin suddenly moves 4% higher.
That's data.
But what caused the move?
Maybe trading volume increased significantly. Perhaps short positions were liquidated. Maybe institutional demand increased. Or perhaps the move happened because of a temporary liquidity imbalance.
Each scenario creates a different trading environment.
This is why experienced traders don't stop at:
"What happened?"
They continue asking:
"Why did it happen?"
And then:
"Does the evidence suggest it could continue?"
That progression from observation to explanation to evaluation is where market data becomes useful.
Start With the Market Before the Asset
One of the easiest mistakes is analyzing an individual token without considering the broader market.
Before evaluating a potential trade, look at the overall environment.
Is Bitcoin trending higher or lower?
Are major altcoins moving with it?
Is volatility elevated?
Are traders becoming more leveraged?
Is there major macroeconomic or regulatory news affecting risk appetite?
A bullish setup on an individual token can behave very differently during a broad market sell-off than during a strong market-wide rally.
Context comes before conviction.
Then Look at the Price Structure
Once the broader environment is clear, technical data helps identify what the asset itself is doing.
Look for:
- Trend direction
- Support and resistance
- Trading volume
- Momentum
- Breakouts and breakdowns
- Volatility
The goal isn't to fill a chart with indicators.
It's to understand the structure of the market.
For example, a breakout accompanied by strong volume can carry more significance than a breakout occurring on weak participation.
Price tells you where the market is moving.
Volume and momentum can help explain how convincing that move may be.
Look Beneath the Chart With On-Chain Data
Crypto provides something traditional markets often don't: publicly visible blockchain activity.
On-chain data can add another layer to your analysis.
Depending on the asset and network, traders may examine:
- Exchange inflows and outflows
- Wallet accumulation
- Large transactions
- Active addresses
- Token movements
- Stablecoin flows
Imagine an asset is showing bullish price action while exchange balances are declining and large wallets are accumulating.
That doesn't guarantee a continued rally.
But it gives the trader another reason to investigate the bullish thesis.
The important word is another.
On-chain data should strengthen or challenge an analysis—not become an automatic buy button.
Whale Activity Is a Clue, Not a Command
Large wallet movements attract attention because whales can have a meaningful effect on liquidity and price.
But a large transaction doesn't automatically mean:
"Whale is selling. Sell now."
A wallet could be:
- Moving funds between its own addresses
- Rebalancing holdings
- Depositing collateral
- Preparing for a trade
- Transferring assets for operational reasons
Without context, the transaction is simply an observation.
The better approach is to combine whale activity with price action, exchange flows, volume, and other market information.
That turns a headline into something you can actually evaluate.
Sentiment Adds the Human Layer
Markets aren't purely mathematical.
People move markets too.
News, social media discussions, narratives, and community sentiment can create powerful short-term momentum.
A trader might therefore monitor:
- News sentiment
- Social media activity
- Community discussions
- Fear and greed indicators
- Emerging narratives
But sentiment has a major weakness: it can change extremely quickly.
That's why extreme optimism can sometimes be a warning rather than confirmation.
If everyone is already convinced that an asset can only go higher, there may be less room for additional buyers to push the market.
Sentiment is useful.
It simply needs to be interpreted rather than blindly followed.
Liquidity Can Change the Meaning of a Setup
Two assets can have identical-looking charts but completely different liquidity conditions.
Liquidity analysis can provide insight into:
- Order book depth
- Open interest
- Funding rates
- Liquidation activity
- Buy and sell pressure
This matters because price can move dramatically when liquidity is thin.
A small amount of buying pressure may create an impressive-looking breakout that quickly reverses.
Understanding liquidity helps traders distinguish between genuine market participation and moves that may be more fragile.
What Happens When the Data Conflicts?
This is actually one of the most valuable situations.
Imagine your chart looks bullish, but on-chain data shows heavy exchange deposits and whale selling.
What should you do?
You don't necessarily have to short the asset.
You also don't have to ignore the conflicting data.
Instead, you can reduce your confidence, wait for additional confirmation, or simply skip the trade.
This is an important mindset shift.
Good market analysis isn't about finding data that agrees with you.
It's about finding data that helps you test whether your idea is actually reasonable.
Turn Data Into a Decision Framework
A simple process can make market analysis much more structured.
1. Observe
What is happening?
2. Investigate
Why might it be happening?
3. Confirm
Do other data sources support the explanation?
4. Challenge
What information contradicts it?
5. Assess Risk
What happens if the thesis is wrong?
6. Decide
Does the opportunity fit your strategy?
This prevents one exciting piece of information from dominating the entire decision.
Where AI Can Help
The amount of market data available today makes this process difficult to perform manually.
AI can help traders process large datasets, identify unusual activity, compare market conditions, and surface patterns that deserve further investigation.
This is particularly useful when information comes from many different sources.
Platforms such as i5.xyz are built around this broader market-intelligence approach, helping traders bring different types of market information together instead of relying on isolated alerts.
The value isn't that AI magically knows what the market will do next.
It's that technology can help reduce the time between data collection and analysis.
The final decision still requires judgment and risk management.
More Data Doesn't Always Mean Better Decisions
There is a point where additional information becomes noise.
A trader monitoring 50 indicators isn't necessarily more informed than someone monitoring five meaningful ones.
The goal should be to identify the data that actually influences your trading decisions.
For example:
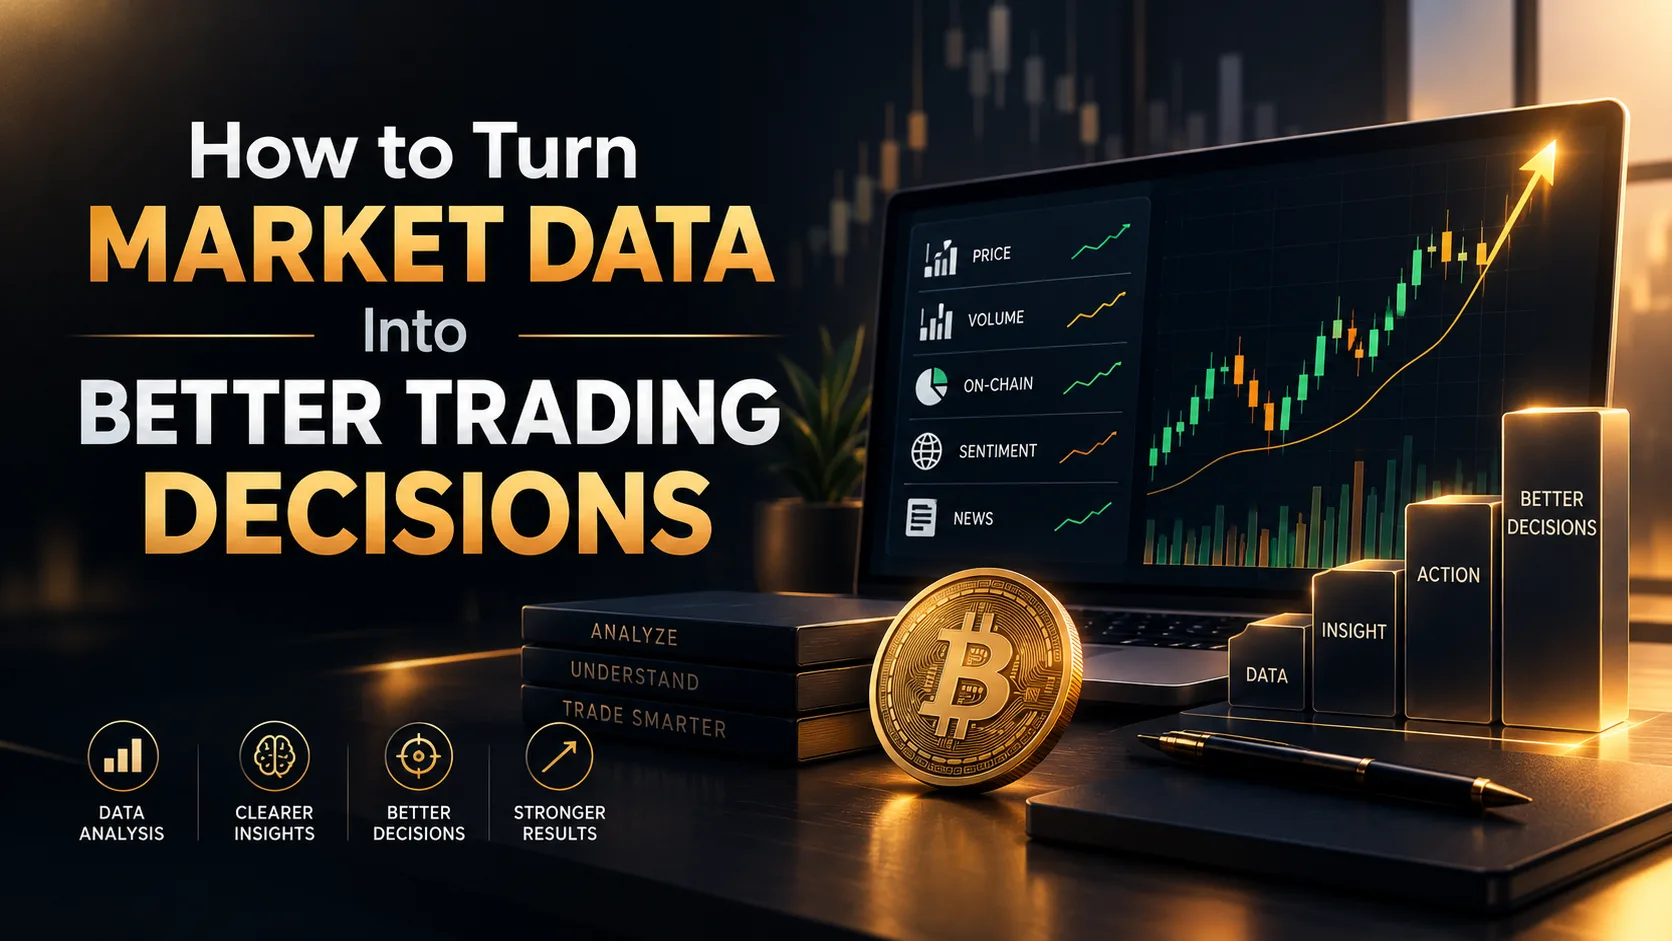
Price + Volume + On-Chain Activity + Liquidity + Sentiment
may be more useful than a dashboard containing dozens of unrelated metrics.
The best workflow isn't the one with the most data.
It's the one that helps you understand the market clearly enough to make a decision.
The Final Step: Connect the Data to Risk
Even when the evidence looks strong, the trade can still fail.
That's why market analysis should always end with risk.
Before entering, consider:
- How much capital am I putting at risk?
- Where does the trading thesis become invalid?
- What is the potential reward compared with the risk?
- Does this position fit my overall portfolio?
- What would make me exit?
A strong thesis without risk management is still an incomplete trading plan.
From Raw Numbers to Better Decisions
Market data is only valuable when it changes the quality of your thinking.
A price chart can show you movement.
On-chain data can show you blockchain activity.
Whale tracking can reveal large transactions.
Sentiment can show how market participants are behaving.
Liquidity can reveal potential pressure points.
AI can help process all of these sources faster.
But the real advantage comes from connecting them.
The objective isn't to predict every move or find a perfect signal.
It's to build a process where decisions are based on evidence, context, and clearly defined risk.
Because in crypto trading, having more data isn't necessarily an edge.
Knowing how to turn that data into a better decision is.