
Markets rarely turn without leaving clues. Before a trend rolls over, momentum usually fades while price still pushes ahead. That quiet mismatch has a name, and seasoned traders watch for it in every session.
Divergence in trading describes this exact disagreement between price and momentum. Price makes a new high, yet the indicator refuses to follow. Price drops to a fresh low, yet momentum quietly improves. In both cases, the crowd driving the move is losing strength.
This guide breaks down how to spot divergence on any chart, which indicators actually help, and how to trade divergence without guessing. By the end, you will read momentum the way an experienced chartist does.
What Divergence in Trading Really Means
Price shows you what traders did. Momentum shows you how hard they worked to do it. When those two stories stop matching, divergence appears.
Think of a runner sprinting uphill. The runner still moves forward, but each step gets shorter and slower. The finish line has not moved, yet exhaustion is already visible. Divergence in trading captures that same exhaustion inside a chart.
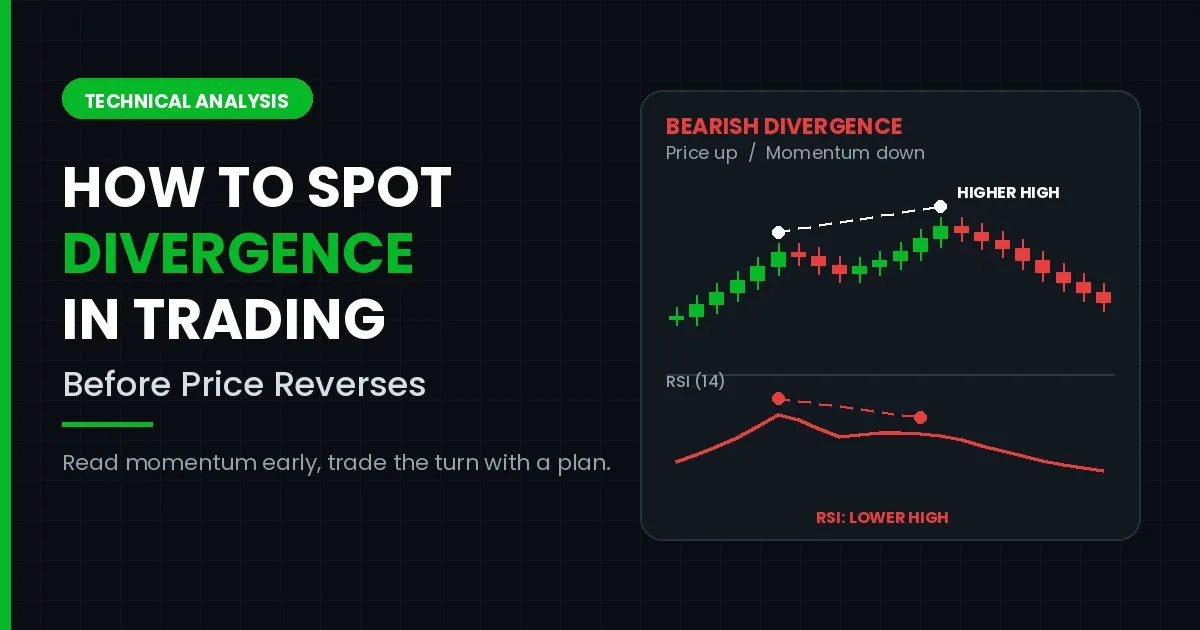
Technically, divergence forms between two swing points. You compare a pair of highs or a pair of lows on price with the matching pair on an oscillator. If price prints a higher high while the oscillator prints a lower high, momentum is fading behind the scenes.
Because of this, divergence works as a warning rather than an instruction. It tells you the current push is running out of fuel. It does not promise an immediate reversal, and that difference matters for every decision you make afterwards.
Why Momentum Weakens Before Price Turns
Every trend needs fresh buyers or fresh sellers. Once new participants stop arriving, the move continues only on leftover orders and momentum slows.
Oscillators measure the speed and size of recent moves, so they react to this shift early. Price can still grind higher on thin volume, yet the indicator already registers smaller pushes. As a result, divergence in trading often appears while headlines still sound bullish.
Sentiment plays a part as well. Late buyers usually arrive after the easy gains have already gone. They chase small moves with heavy risk, and momentum readings capture that hesitation almost immediately.
Institutional behaviour adds to the effect. Large players scale out gradually instead of dumping positions at once. Their quiet distribution flattens momentum long before price cracks, and that footprint is exactly what trading divergence signals reveal.
Bullish and Bearish Divergence Explained
Most setups fall into two families. Learning both properly removes almost all confusion around bullish and bearish divergence.
Bullish Divergence
Bullish divergence forms during a downtrend. Price carves a lower low, while the oscillator carves a higher low. Sellers are still winning on the surface, yet their punches are getting weaker.
Traders read this as building demand. Each new low attracts buyers a little faster than before. Consequently, the market becomes vulnerable to a bounce or a full trend change.
Bearish Divergence
Bearish divergence appears during an uptrend. Price stretches to a higher high, while the oscillator rolls over into a lower high. Buyers keep lifting price, but they need far more effort for far less reward.
This pattern often shows up near the end of an extended rally. Supply quietly builds, momentum drains, and one negative catalyst can flip the chart quickly.
Hidden Divergence
There is a third variation worth knowing. Hidden divergence, often called continuation divergence, points in the direction of the existing trend instead of against it.
In an uptrend, price makes a higher low while the oscillator makes a lower low. Momentum looks weak, yet buyers defend the structure. Such setups usually resolve upward, so they suit trend followers who want low-risk entries during pullbacks.
How to Spot Divergence in Five Practical Steps
Learning how to spot divergence becomes simple once you follow a fixed routine. Use the same five steps on every chart.
Step 1: Identify the trend first. Zoom out and label the market as up, down, or ranging. Context decides whether a signal deserves attention.
Step 2: Mark clear swing points. Choose obvious highs and lows that stand out visually. Small wiggles inside a candle cluster produce noise, not signals.
Step 3: Add one momentum indicator. RSI, MACD, or the Stochastic Oscillator all work well. One tool is enough, because three tools rarely agree at the same moment.
Step 4: Compare the slopes. Draw a short line across the two price swings, then draw a matching line across the two indicator swings. Opposite slopes confirm divergence.
Step 5: Wait for confirmation from price. This step separates disciplined traders from frustrated ones. Divergence sets the alert, while price action gives the green light.
Follow these steps in order and you will filter out most weak setups before risking a single dollar.
Choosing an Indicator for Trading Divergence Signals
Different oscillators highlight different behaviour, so your choice shapes the quality of your signals.
RSI remains the most popular option. It reacts quickly and shows clean swing points, especially on the 14-period setting. Many traders pair RSI with the 50 level to judge overall momentum direction.
MACD suits traders who prefer smoother output. Because it uses moving averages, it produces fewer signals with slightly better reliability. The histogram also makes fading momentum easy to see.
The Stochastic Oscillator excels in ranging markets. It flags exhaustion near range boundaries, where reversals happen often. However, it whipsaws badly in strong trends, so treat its signals with extra caution there.
Volume deserves a mention too. Falling volume alongside a new price extreme supports the same conclusion, and it strengthens any divergence in trading you have already spotted.
How to Trade Divergence With a Real Plan
Spotting a pattern is the easy half. Turning it into a repeatable process is where most traders struggle, so build a simple framework instead.
Start with location. The strongest setups form at meaningful levels such as prior support, resistance, or a well-tested trendline. A signal in the middle of nowhere carries far less weight.
Next, demand confirmation. Wait for a break of a short-term trendline, a shift in market structure, or a strong engulfing candle. Momentum divergence plus a structural break is a much better combination than momentum alone.
Then define your risk before entry. Place your stop beyond the swing point that created the divergence. If price violates that level, the reasoning behind the trade is simply gone.
Finally, plan your exit. Many traders target the previous swing point or a major level in the opposite direction. Others trail their stop behind each new structure. Either approach beats holding a position and hoping.
Position size deserves the same discipline. Because divergence signals timing rather than certainty, risking one percent or less per idea keeps a losing streak survivable.
Reading a Real Setup Step by Step
Imagine a stock rallying for six weeks on the daily chart. Price prints a high near 120, pulls back for a few sessions, then stretches to 126 two weeks later.
RSI tells a different story. At the first high it reached 78. At the second high it managed only 64. Price climbed, momentum shrank, and a clean bearish signal appeared.
An experienced trader still waits. The 126 area sits inside an old resistance zone from last quarter, so location already supports the case. Attention now shifts to structure.
Two sessions later, price breaks the rising trendline that guided the whole rally. A wide bearish candle then closes below the previous swing low, which confirms the setup.
Entry follows that close. The stop sits just above 126, because a move beyond it destroys the reasoning. The first target rests near the earlier consolidation around 112.
Notice the order of events here. Divergence opened the investigation, location strengthened it, and price action finally approved it. Skipping any of those layers turns a solid process into a coin flip. The same discipline applies whether you're reading charts manually or relying on a crypto trading bot — automation can execute the rules faster, but it still needs this layered logic built in to avoid chasing a signal that lacks context.
Common Mistakes That Ruin Good Signals
Even accurate observation fails without judgement. These errors cause most divergence losses.
Fighting a powerful trend. Strong trends can produce three or four divergences before turning. Selling every bearish signal in a runaway rally drains accounts fast.
Using tiny swing points. Divergence between two minor wiggles means almost nothing. Significant swings produce significant information.
Entering too early. A divergence without confirmation is a hypothesis. Traders who enter immediately often watch price extend against them for days.
Ignoring higher timeframes. A four-hour signal against a strong weekly trend faces heavy resistance. Alignment across timeframes improves odds noticeably.
Switching indicators until one agrees. Cherry-picking creates a signal that never existed. Pick your tool, then respect what it shows.
Timeframes and Signal Quality
Not all signals carry equal weight, and timeframe explains much of that difference.
Daily and four-hour charts produce the most reliable divergence in trading, because larger participants operate there. Signals develop slowly, which gives you time to plan and to size correctly.
Lower timeframes such as five-minute charts generate signals constantly. Some work beautifully, yet noise increases sharply. Scalpers can use them, but only with tight risk control and quick decisions.
Weekly charts sit at the other extreme. Signals there appear rarely, yet they often mark major turning points. Long-term investors use them to time entries instead of trading every wobble.
A practical habit solves this problem. Identify the trend on a higher timeframe, then hunt for divergence one or two steps lower. This top-down routine keeps your trades aligned with the dominant flow.
A Quick Checklist Before You Click Buy or Sell
Run through these questions every time. If you cannot answer all of them clearly, skip the trade.
- Is the trend direction clear on the higher timeframe?
- Are both swing points obvious rather than marginal?
- Does one indicator, not three, show the mismatch?
- Is the signal forming at a significant price level?
- Has price confirmed with a structure break or reversal candle?
- Do I know my stop loss and target before entry?
Traders who complete this checklist consistently report calmer decisions and fewer impulsive entries. Consistency, after all, comes from process rather than prediction.
Final Thoughts
Divergence rewards patience more than cleverness. It shows you where conviction is fading, which is valuable information at any level of experience. Still, it remains one input inside a complete plan that includes trend context, confirmation, and defined risk.
Practise on historical charts before risking capital. Mark twenty examples, note which ones worked, and study what the winners shared. That exercise teaches more than any shortcut, and it builds the pattern recognition that separates confident traders from anxious ones. At GainzAlgo, we believe traders perform best when they understand the logic behind every signal they act on, so keep studying momentum, keep your risk small, and let the chart do the talking.