
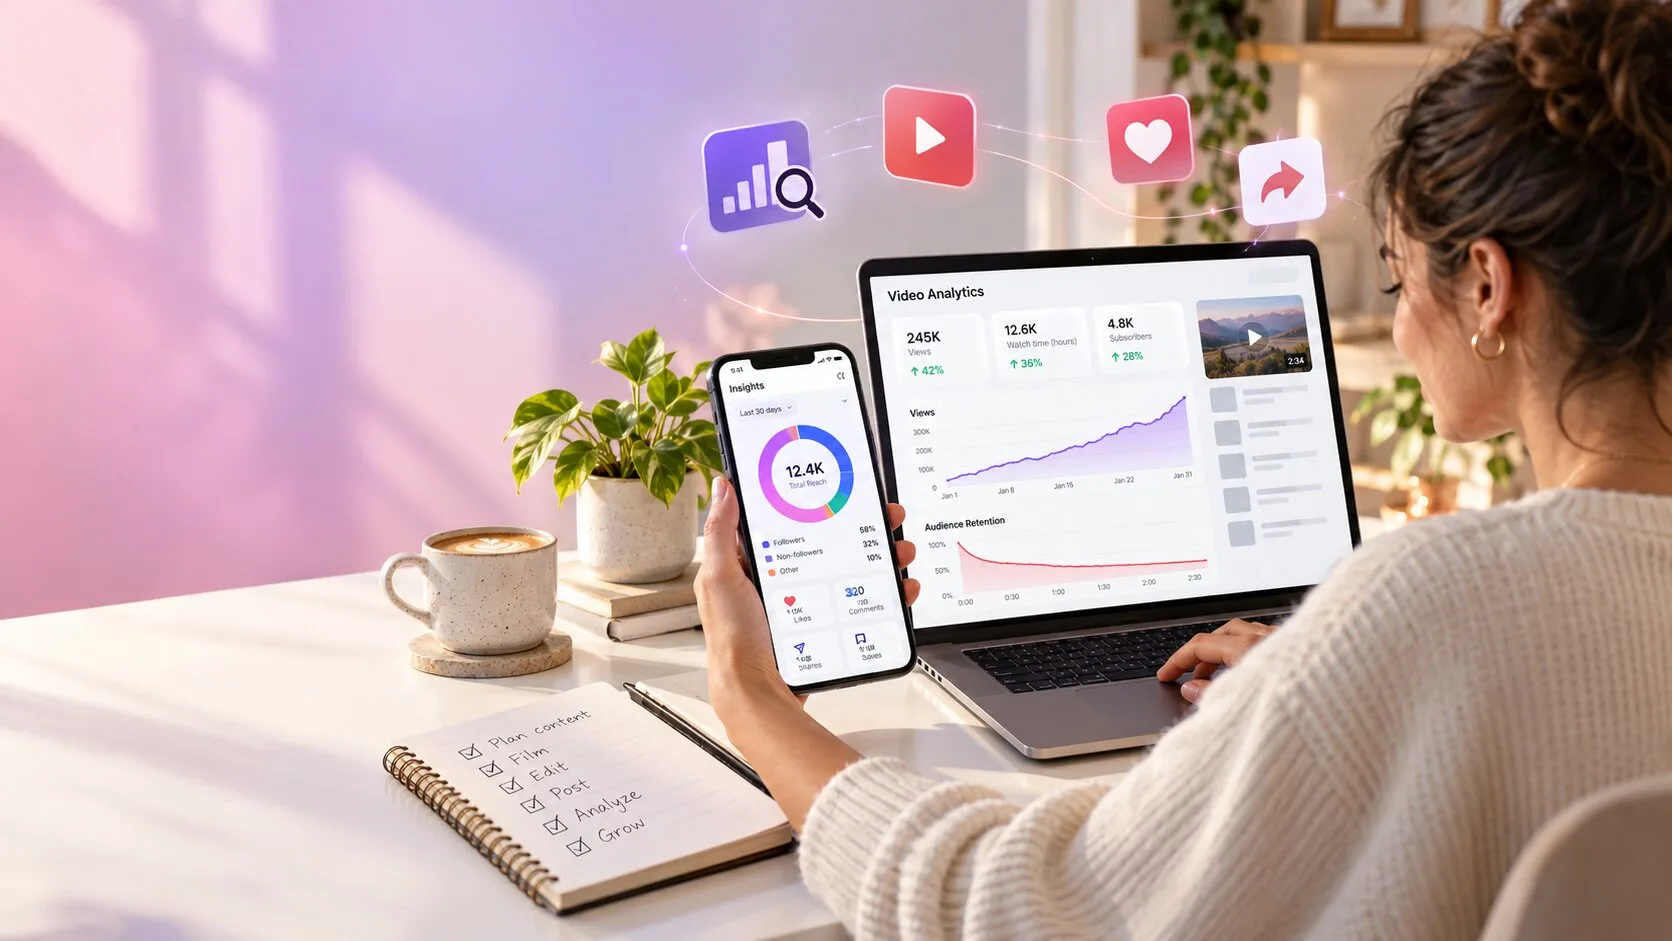
Your analytics are already telling you what to post next. Most people just don't know where to look.
Instagram Insights and YouTube Studio both give you far more data than you need, and neither one explains what to do with it. So you open the dashboard, see a graph going up or down, feel good or bad for a second and close it again.
This article walks you through how to read your Instagram and YouTube analytics step by step: where to find each report, which numbers deserve your attention and how to turn them into better content. You don't need to be a data person.
Before you start: set up the basics
On Instagram, analytics (called Insights) only work on a Creator or Business account. If you're still on a personal account, switch in your settings. It's free, and posts from before the switch won't have data.
On YouTube, every channel gets analytics through YouTube Studio. Open it on desktop (studio.youtube.com) or in the YouTube Studio app, and click Analytics in the left menu. For a single video, go to Content, hover over the video and click the analytics icon.
One tip before we go further: always look at a longer date range first, like the last 28 or 90 days. Single-day numbers jump around too much to tell you anything useful.
How to read Instagram Insights
Instagram reorganized Insights in 2026 into three main areas: Overview, Engagement and Audience. Layouts can shift slightly between app updates, but the metrics themselves stay fairly consistent.
Overview: views, reach and follows
This is your quick health check. You'll see:
- Views: how many times your content was seen, including repeat views. Instagram now uses views as its main headline metric across Reels, posts and Stories.
- Accounts reached: how many unique people saw your content.
- Profile visits and follows: how many people checked out your profile and how many hit follow.
The most useful detail here is the split between followers and non-followers. If almost all your views come from people who already follow you, your content isn't being pushed to new audiences. If a big chunk comes from non-followers, Instagram is testing your posts on fresh people, which is how accounts grow.
Here's a quick way to think about it. A local bakery with 4,000 followers gets 3,000 views on a Reel, and 85% of those are followers. That's a loyal audience, but no growth. The next Reel shows a baker scoring sourdough in slow motion and gets 18,000 views, 70% from non-followers. Now they know what kind of content travels.
Engagement: the metrics that show what people value
The Engagement section breaks down likes, comments, saves, shares and reposts. Two newer metrics deserve special attention.
Share rate shows what percentage of viewers passed your content on through DMs, Stories or outside the app. Shares are one of the strongest signals Instagram uses to show content to new people, so a high share rate is one of the best signs you've got.
Skip rate applies to Reels. It shows how quickly people swipe away. A high skip rate usually means your first second or two isn't grabbing attention. It's a hook problem, not necessarily a content problem.
Reels also come with a retention chart showing where viewers drop off. If you see a steep fall at the three-second mark, open the Reel and watch that moment. You'll usually spot the issue quickly: a slow start, text that's hard to read or a moment where nothing happens.
Saves deserve a mention too. A post with modest likes but lots of saves is often your most valuable content, because people found it useful enough to come back to.
Audience: who's actually watching
The Audience section shows your followers' top locations, age ranges, gender and, most usefully, when they're most active. Check the hours and days chart and post roughly an hour before your audience's peak.
Also look at location. If you run a salon in Pune and 60% of your audience is outside India, your content is entertaining people who will never book an appointment. That's worth knowing.
How to read YouTube Analytics
YouTube Studio is more detailed than Instagram, which makes it more powerful and a little more overwhelming. Here's how to approach each tab.
Overview: the big picture
The Overview tab shows views, watch time, subscribers and (if you're monetized) estimated revenue for your chosen date range. It also includes a Realtime card with views from the last 48 hours and a Typical performance comparison that tells you whether a new video is doing better or worse than your usual uploads.
It measures you against your own history, which is the only fair benchmark.
Content: what's working
The Content tab lets you filter by Videos, Shorts, Live and Posts. For each one, you'll see how impressions turn into views and watch time.
Pay close attention to two numbers:
Impressions click-through rate (CTR) is the percentage of people who saw your thumbnail and clicked. It's your thumbnail and title's report card. There's no single "good" CTR, because it naturally drops as YouTube shows your video to wider, colder audiences. Compare it to your own channel average instead.
Average view duration tells you how long people stay. Pair it with the audience retention graph at the video level. A gentle downward slope is normal. Sudden cliffs are what you're hunting for.
Here's how the two work together:
CTRRetentionWhat it usually meansHighHighWinning video. Make more like it.HighLowThumbnail promises something the video doesn't deliver.LowHighGreat video, weak packaging. Test a new thumbnail or title.LowLowRethink the topic or angle.Reach and traffic sources
At the video level, the Reach section shows traffic sources: where your views came from. The main ones are Browse features (home page), Suggested videos, YouTube search, Shorts feed and External (links from other sites).
This tells you how YouTube is treating your video. If most views come from search, you've made something people are looking for, which tends to bring in views steadily for months. If they come from Browse and Suggested, the algorithm is actively recommending you. If almost everything is External, you're relying on sharing it yourself, and YouTube hasn't picked it up yet.
Engagement: watch time and engaged views
The Engagement section focuses on watch time and average view duration, plus engaged views for Shorts. It also shows your top videos by watch time and which end screen elements get clicked.
Watch time feeds directly into monetization. From February 1, 2027, new Partner Program applicants will need 8,000 public watch hours in the past year (up from 4,000), or 20 million Shorts views in 90 days. If monetization is your goal, this is the tab to watch.
Audience: new, casual and regular viewers
The Audience tab splits viewers into new, casual and regular viewers. A healthy channel needs all three. Lots of new viewers but few regulars means people find you but don't come back, so work on consistency and series content. Lots of regulars but few new viewers means you've got a loyal base that isn't growing, so focus on searchable topics and stronger thumbnails.
You'll also find when your viewers are on YouTube, their top countries and age groups, and a report showing other channels and videos your audience watches. That last report is excellent for video ideas.
Trends: finding your next video
The Trends tab shows what your audience and viewers in general are searching for on YouTube. It's the closest thing YouTube gives you to a content planning tool. Look for searches with lots of interest and few good videos answering them.
Where Buylikesservices fits in
When an account is brand new, there's barely enough data to learn from. Some creators and small businesses use services like Buylikesservices to give their profile early social proof, so new visitors don't land on a page that looks empty.
If you consider it, know the trade-off. Purchased engagement can make a profile look more established, but those numbers also show up in your analytics and can blur the picture of what real viewers think. Bought followers who never interact can drag down your reach and engagement rate, and both Instagram and YouTube have rules against artificial engagement. Read the platform policies first. And when you analyze your data, focus on the metrics that reflect real behavior, like retention, saves, shares and traffic sources.
Turn your analytics into a simple weekly habit
You don't need hours for this. Once a week, spend 15 minutes and answer three questions:
- Which post or video did best, and why do I think it worked?
- Where did people drop off or skip, and what can I fix next time?
- Where are new viewers coming from?
Write the answers down. After a month, you'll have a clear pattern of what your audience responds to, based on your own numbers.
Reading your Instagram and YouTube analytics isn't about memorizing every metric. It's about knowing which numbers answer your questions and acting on what they tell you. Start with reach, retention and shares, check them weekly and let your next post be a little smarter than your last.