
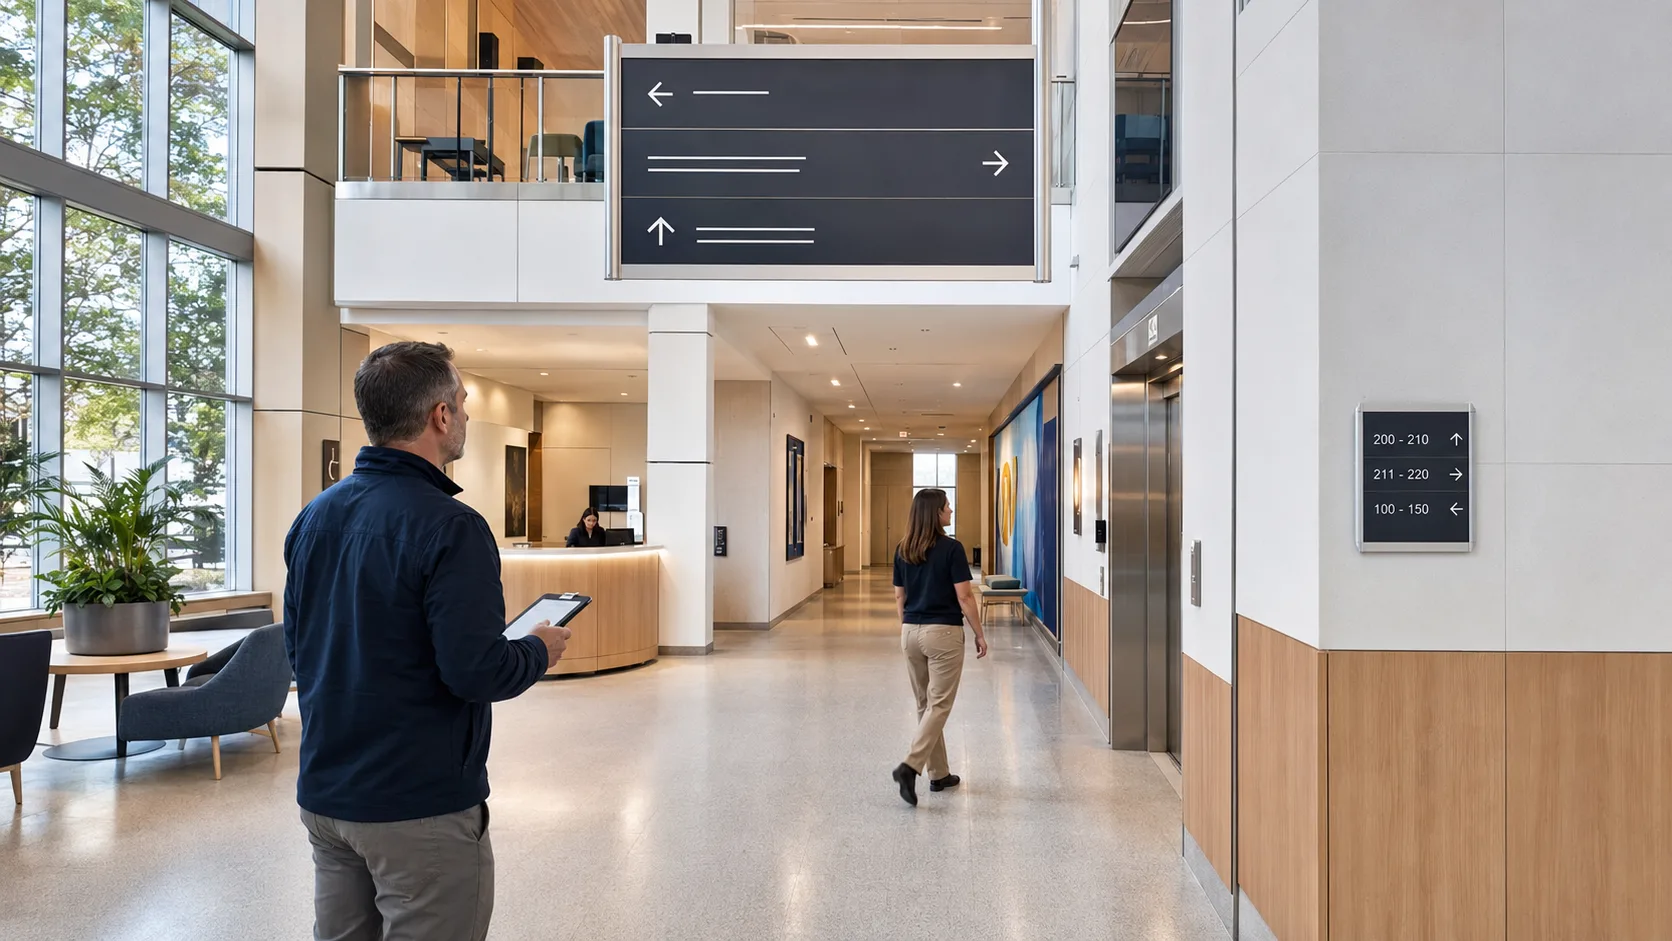
A wayfinding system can look complete on a floor plan and still fail in daily use. Directories may be present at entrances, directional signs may appear in hallways, and rooms may be clearly labeled. Yet visitors can still hesitate at intersections, enter the wrong corridor, or repeatedly ask employees for directions.
This happens because signage is often evaluated by appearance and installation rather than by performance. A more useful question is not simply whether signs are present, but whether people can reach their destinations accurately, independently, and without unnecessary delay.
Facility managers can evaluate wayfinding using a structured test built around actual visitor journeys. The following framework introduces measurable indicators that can be used in offices, universities, hospitals, government buildings, transportation facilities, and other complex public environments.
Begin With Real Visitor Journeys
A wayfinding audit should begin by identifying the routes that visitors use most frequently.
Examples may include:
- Main entrance to reception
- Reception to a meeting room
- Elevator to a specific department
- Entrance to the nearest accessible restroom
- Parking entrance to the main lobby
- Department to the nearest public exit
- Lobby to a service counter
One building wing to another
A route should include the complete journey, not only the hallway where a sign is installed. Visitors need information at the beginning of the journey, at each point where they must choose a direction, and when they arrive at the destination.
For a basic audit, select five important routes and ask four first-time users to complete each one. This produces 20 observed journeys, which is enough to reveal repeated problems without turning the review into a large research project.
Participants should not receive verbal directions before starting. They should be given only the destination name and the location where their journey begins.
During each test, record:
- Whether the participant reached the correct destination
- Total journey time
- Number of wrong turns
- Number of stops or hesitation points
- Whether assistance was requested
- Where the participant first became uncertain
- How long it took to recover from a wrong turn
These observations can be converted into clear performance metrics.
1. First-Attempt Success Rate
The first-attempt success rate measures the percentage of journeys completed without a wrong turn or request for assistance.
The formula is:
First-Attempt Success Rate = Successful Independent Journeys ÷ Total Tested Journeys × 100
Suppose 20 journeys are tested and 15 are completed without a wrong turn or assistance request:
15 ÷ 20 × 100 = 75%
This means one-quarter of the observed journeys encountered a meaningful navigation problem.
The metric should be calculated for the entire building and for individual routes. A building may achieve a reasonable overall result while one destination, such as a meeting suite or second-floor department, consistently creates confusion.
2. Wrong-Turn Frequency
A wrong turn occurs when a visitor enters a route that does not lead toward the assigned destination.
The average frequency can be calculated as:
Wrong-Turn Frequency = Total Wrong Turns ÷ Total Tested Journeys
If participants make nine wrong turns across 20 journeys:
9 ÷ 20 = 0.45 wrong turns per journey
This number becomes more valuable when the location of each wrong turn is recorded. If six of the nine errors occur at the same corridor intersection, the problem is probably not the visitor. It may indicate that a directional sign is absent, difficult to see, positioned too late, or using terminology that does not match what visitors expect.
A wrong-turn map can be created by marking each error on a printed floor plan. Locations with repeated errors should receive priority during the signage review.
3. Assistance Request Rate
Visitors frequently compensate for weak wayfinding by asking receptionists, security personnel, or other employees for directions. The request solves the immediate problem but hides the underlying navigation issue.
The assistance request rate can be calculated as:
Assistance Request Rate = Journeys Requiring Human Assistance ÷ Total Tested Journeys × 100
If six of 20 tested journeys require assistance:
6 ÷ 20 × 100 = 30%
This metric can also be tracked operationally. Reception and security staff can record common direction requests for one or two weeks. Repeated questions such as “Where is Conference Room B?” or “How do I return to the main lobby?” can identify gaps that a visual inspection may overlook.
Employees should not be expected to remember every request throughout the day. A simple tally sheet listing common destinations can provide more reliable information.
4. Decision-Point Coverage Rate
A decision point is a location where a visitor must choose between two or more possible routes. Examples include corridor intersections, elevator lobbies, stair landings, and entrances connecting different departments.
The decision-point coverage rate measures how many ambiguous choices provide adequate directional information.
The formula is:
Decision-Point Coverage Rate = Signed Ambiguous Decision Points ÷ Total Ambiguous Decision Points × 100
Suppose an audit identifies 16 decision points where the correct route is not immediately visible, but only 12 provide appropriate guidance:
12 ÷ 16 × 100 = 75% coverage
The remaining four locations should be reviewed for additional or improved directional information.
A sign should be visible before the visitor commits to a route. Information positioned after an intersection may technically be present but still arrive too late to support the decision.
5. Hesitation Rate
Not every wayfinding problem produces a wrong turn. A visitor may stop, look repeatedly between different signs, return to a directory, or wait until another person passes.
These behaviors indicate uncertainty even when the correct destination is eventually reached.
For a consistent audit, a hesitation event can be defined as an unplanned stop lasting more than five seconds while the participant searches for directional information.
The calculation is:
Hesitation Rate = Journeys With at Least One Hesitation Event ÷ Total Tested Journeys × 100
If 11 of 20 journeys include at least one recorded hesitation:
11 ÷ 20 × 100 = 55%
A high hesitation rate combined with a relatively high success rate may mean that visitors eventually find the destination, but the process requires unnecessary mental effort and time.
6. Recovery Time After an Error
Recovery time measures how long a visitor takes to recognize and correct a wrong route.
The calculation is:
Average Recovery Time = Total Time Spent Recovering From Errors ÷ Number of Recorded Errors
If nine wrong turns produce a combined recovery time of 666 seconds:
666 ÷ 9 = 74 seconds per error
Recovery time can reveal whether the system helps users correct mistakes. Reassurance signs, room-number sequences, floor identifiers, and return directions can prevent a minor error from becoming a lengthy detour.
A visitor who makes a wrong turn but corrects it within several seconds has experienced a different level of difficulty from someone who walks to the end of a corridor before realizing the mistake.
Apply the Framework to Different Building Types
The measurement process remains consistent, but the routes and terminology should reflect how each facility operates.
A university may test journeys from visitor parking to admissions, lecture rooms, faculty offices, and student services. A government building may focus on security screening, public counters, hearing rooms, and exits. A corporate office may prioritize reception, meeting rooms, restrooms, and department locations.
Healthcare environments can involve several overlapping journeys, including emergency services, outpatient clinics, diagnostic departments, patient rooms, administrative offices, and visitor facilities. When reviewing these environments, facilities teams can compare their route findings with available office signs for hospitals and other healthcare identification options to determine which formats match the destinations identified during the audit.
The product or sign format should be selected after the navigation requirement is understood—not before.
Include Accessibility in the Review
Performance testing does not replace accessibility compliance.
Under the 2010 ADA Standards, signs identifying permanent rooms and spaces are subject to specific requirements. Applicable signs may need raised characters, Braille, appropriate visual contrast, a non-glare finish, and compliant mounting positions.
The standards specify that the baseline of the lowest tactile character must be at least 48 inches above the finished floor, while the baseline of the highest tactile character must not exceed 60 inches.
The U.S. Access Board also provides guidance for locating tactile signs beside different door configurations. At a single door, the sign is generally positioned on the latch side. Additional provisions apply to double doors and situations where sufficient wall space is unavailable.
These requirements should be reviewed separately by qualified professionals. A sign can perform well during a general visitor test while still failing to meet an applicable accessibility requirement.
Conduct the Audit in Two Rounds
The first audit should establish a baseline before changes are made.
For example, a facility may record:
- 75% first-attempt success
- 0.45 wrong turns per journey
- 30% assistance request rate
- 75% decision-point coverage
- 55% hesitation rate
- 74 seconds of average recovery time
These figures are an illustrative example, not general industry benchmarks.
After improving sign placement, terminology, directories, or room identification, the same routes should be tested again with different first-time users.
Using the same starting points, destinations, definitions, and recording method makes the results easier to compare. If the first-attempt success rate improves while wrong turns and assistance requests decline, the changes are producing a measurable benefit.
Review Terminology as Well as Placement
A sign may be visible and still create confusion if its wording does not match the language visitors were given.
For example, an appointment notice might direct someone to “Diagnostic Imaging,” while building signs use only “Radiology.” A visitor may be looking for “Human Resources” while the directory lists the department as “People Operations.”
During the audit, record the terms participants search for and compare them with the wording displayed throughout the building.
The same destination should use consistent language on:
- Appointment messages
- Websites
- Directories
- Directional signs
- Room identification signs
- Printed visitor instructions
Where two terms are commonly used, displaying both may reduce uncertainty.
Treat Wayfinding as an Operational System
Wayfinding should be evaluated in the same way as other building systems: through documented requirements, observable performance, and periodic review.
Renovations, department relocations, staffing changes, and new visitor procedures can make an existing sign system less effective over time. An annual audit or a review after major layout changes can identify problems before temporary labels and repeated verbal directions become normal.
A useful assessment does not need expensive tracking equipment. A floor plan, stopwatch, observation sheet, and small group of first-time users can produce actionable findings.
By measuring success rates, wrong turns, assistance requests, decision-point coverage, hesitation, and recovery time, facility managers can move beyond asking whether a building has enough signs. They can determine whether the wayfinding system actually helps people reach their destinations.