
If your team still exports ERP data to Excel every Monday morning, you already know the problem. By the time the report is cleaned, formatted and emailed, the numbers are a week old, and decisions are being made on yesterday's reality.
Your ERP holds the most valuable data in your business: sales, inventory, purchases, payroll, finance. But an ERP is built to record transactions, not to explain them. That is where Power BI comes in. When the two are integrated, raw transactions become a live Power BI dashboard that shows what is happening in your business right now, and what to do about it.
In this guide, Izoe Solutions explains how Power BI and ERP integration works, where it improves operational efficiency, and how to get started without a massive IT project.
What Is Power BI and ERP Integration?
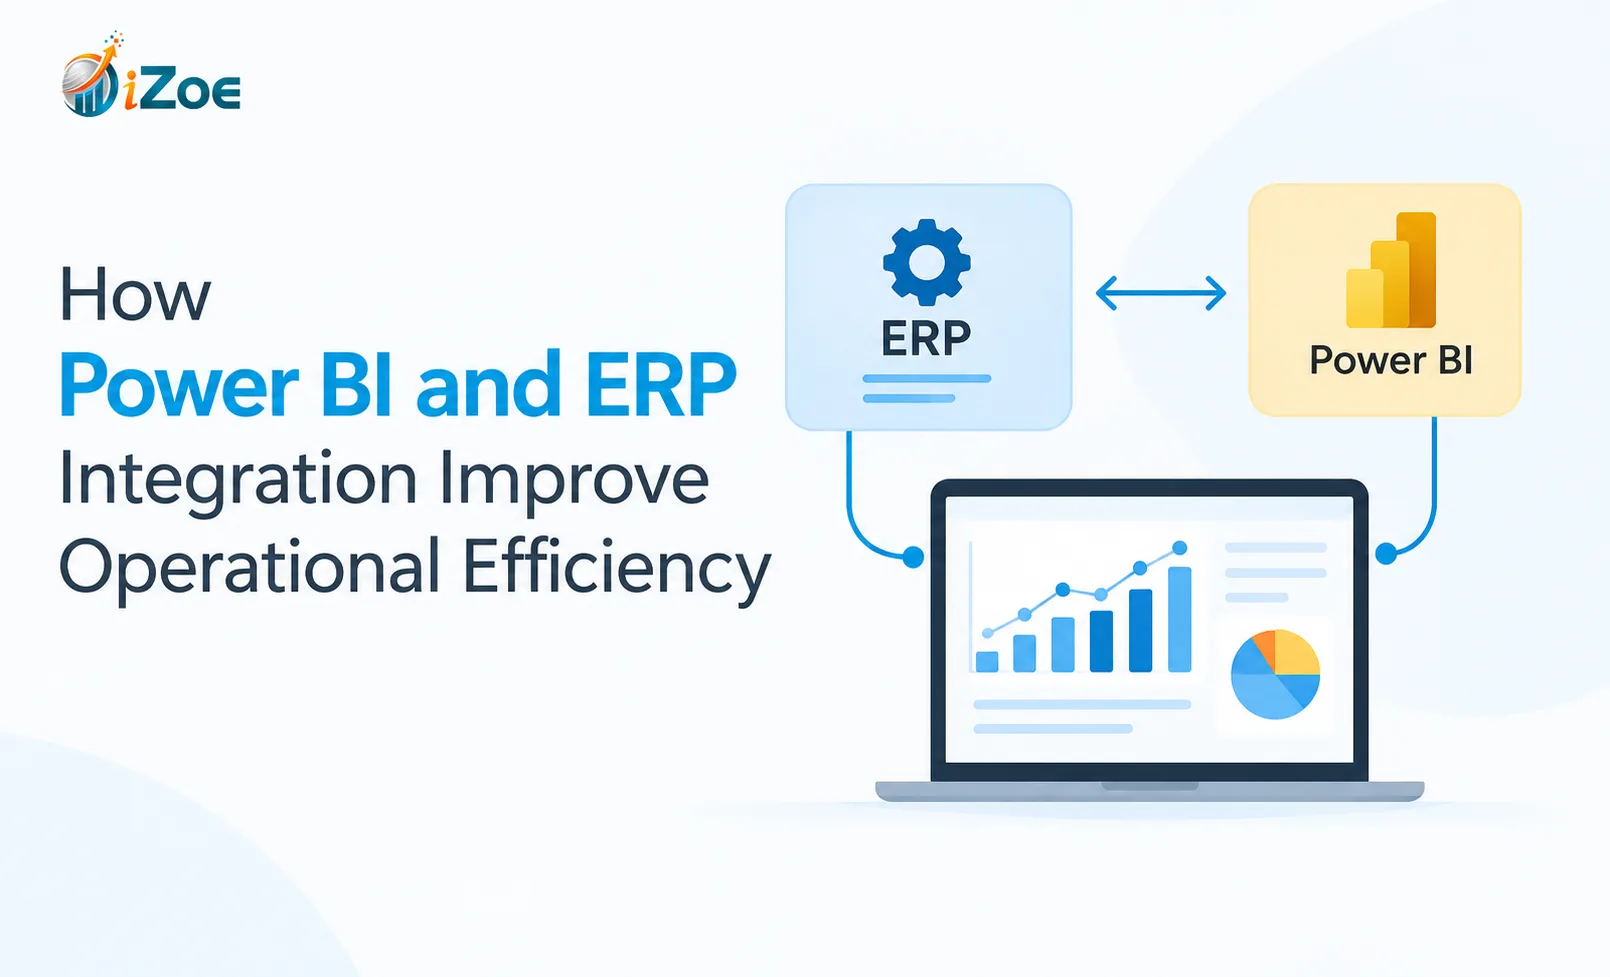
Power BI and ERP integration means connecting Microsoft Power BI to your ERP database or APIs so that data flows automatically into interactive reports and dashboards. Instead of manual exports, your Power BI dashboard refreshes on a schedule (or near real time) directly from the source system.
It works with most modern platforms, including Odoo, Tally, SAP Business One, Microsoft Dynamics and custom ERPs, typically through direct database connectors, REST APIs or a central data warehouse.
Why ERP Reporting Alone Is Not Enough
Most ERPs ship with standard reports. They are useful, but they usually fall short in four ways:
- Rigid formats: hard to slice data by custom dimensions like region, salesperson, product line or customer segment.
- Siloed modules: sales, inventory and finance are reported separately, so no one sees the full picture.
- Slow turnaround: custom reports need a developer or a manual spreadsheet process.
- Limited visuals: tables of numbers rarely reveal trends, outliers or risks at a glance.
Power BI closes these gaps with drag-and-drop visuals, cross-module data models and self-service analytics that business users can explore on their own.
7 Ways Power BI and ERP Integration Improve Operational Efficiency
1. Real-Time Visibility Across the Business
A single Power BI dashboard can combine sales, stock, receivables and production data on one screen. Leaders stop asking "Can someone pull that report?" and start seeing answers instantly.
2. Hours of Manual Reporting Eliminated
Automated refresh replaces the weekly export-clean-paste routine. Finance and operations teams typically reclaim many hours per month, time that moves from compiling numbers to acting on them.
3. Faster, Data-Driven Decision Making
When managers can drill from a company-wide KPI down to a single invoice or SKU in a few clicks, decisions that once took days take minutes. Alerts can even notify you when a metric crosses a threshold.
4. Smarter Inventory and Supply Chain Control
Connect stock levels, purchase orders, supplier lead times and sales velocity to spot slow-moving items, prevent stockouts and reduce working capital locked in inventory.
5. Stronger Financial Control and Cash Flow Forecasting
Track receivables ageing, payables, margins and budget vs. actuals in real time. Pair this with Izoe's CFO services and you move from reporting the past to forecasting the future.
6. One Version of the Truth
When every department works from the same governed dataset, arguments about whose spreadsheet is right disappear. Role-based security makes sure each person sees only what they should.
7. Early Detection of Bottlenecks and Risks
Production delays, rising return rates, late deliveries or declining customer repeat rates show up as visual trends long before they hit your P&L.
Real-World Use Cases
Finance and Accounting
- Profit and loss by branch, product or customer
- Receivables ageing and collection tracking
- GST and expense analysis
- Budget vs. actual variance dashboards
Sales and CRM
- Pipeline value and conversion rate by stage
- Sales performance by rep, region and product
- Customer lifetime value and churn indicators
Inventory and Manufacturing
- Stock turnover and reorder-level alerts
- Production efficiency and downtime tracking
- Supplier performance scorecards
HR and Operations
- Headcount, attrition and attendance trends
- Project profitability and utilisation rates
Key Metrics to Include in Your Power BI Dashboard
A great dashboard is focused, not crowded. Start with 8 to 12 KPIs such as:
- Revenue, gross margin and net profit
- Days sales outstanding (DSO)
- Inventory turnover ratio
- Order fulfilment cycle time
- Sales pipeline conversion rate
- Cash conversion cycle
- Budget variance percentage
- Customer retention rate
How to Integrate Power BI with Your ERP: Step by Step
- Define business questions first. List the 10 decisions your leadership team makes weekly and the data they need.
- Audit your ERP data. Identify tables, modules and data quality issues such as duplicates and missing fields.
- Choose a connection method. Options include direct database connection, API, or a data warehouse for larger setups.
- Build the data model. Create clean relationships between sales, finance, inventory and customer tables.
- Design the dashboard. Use clear visuals, consistent colours and drill-through pages.
- Set refresh schedules and security. Configure row-level security and automated refresh.
- Train your team and iterate. Adoption matters more than design. Collect feedback and refine every month.
Common Mistakes to Avoid
- Building dashboards before agreeing on KPI definitions
- Skipping data cleaning and then losing trust in the numbers
- Overloading a single page with too many visuals
- Ignoring user roles and data security
- Treating the project as one-off instead of an evolving analytics practice
Where AI Takes It Further
Power BI now includes AI-assisted features such as natural-language questions, anomaly detection, smart narratives and Copilot-style assistance. Combined with AI modules on your ERP, you can automate invoice matching, forecast demand and flag unusual transactions automatically. This is the direction business intelligence is moving through 2026: from descriptive dashboards to predictive and prescriptive insight.
Power BI with Odoo, Tally and Other ERPs
At Izoe Solutions, we integrate Power BI with the platforms Indian businesses actually use:
- Odoo: connect through PostgreSQL or API for sales, inventory, accounting and manufacturing dashboards.
- Tally (including Tally on cloud): turn day-books and ledgers into interactive financial dashboards.
- Custom and legacy ERPs: build a data layer that makes older systems analytics-ready.
Conclusion
Your ERP already contains the answers to your biggest operational questions. Power BI makes those answers visible, timely and actionable. The result is less manual work, fewer blind spots and faster decisions across every department.
Frequently Asked Questions
What is Power BI ERP integration?
Power BI ERP integration connects Microsoft Power BI to your ERP system so data flows automatically into live reports and dashboards, removing manual exports and giving real-time business visibility.
How does a Power BI dashboard improve operational efficiency?
A Power BI dashboard centralises data from sales, finance, inventory and operations, automates reporting, highlights bottlenecks early and helps teams make faster, evidence-based decisions.
Can Power BI connect to Odoo and Tally?
Yes. Power BI can connect to Odoo through its database or API and to Tally through ODBC or data export connectors, enabling dashboards across accounting, sales and inventory.
How long does Power BI and ERP integration take?
A focused first dashboard can often be live in two to four weeks. Complex multi-module or multi-entity setups take longer, depending on data quality and scope.
Is Power BI suitable for small and mid-sized businesses?
Yes. With flexible licensing and quick-to-build dashboards, Power BI is cost-effective for startups and SMEs that want enterprise-grade analytics without enterprise budgets.
Do I need a data warehouse to use Power BI with my ERP?
Not always. Smaller businesses can connect directly to the ERP database. A data warehouse becomes valuable as data volume, number of sources and reporting complexity grow.