
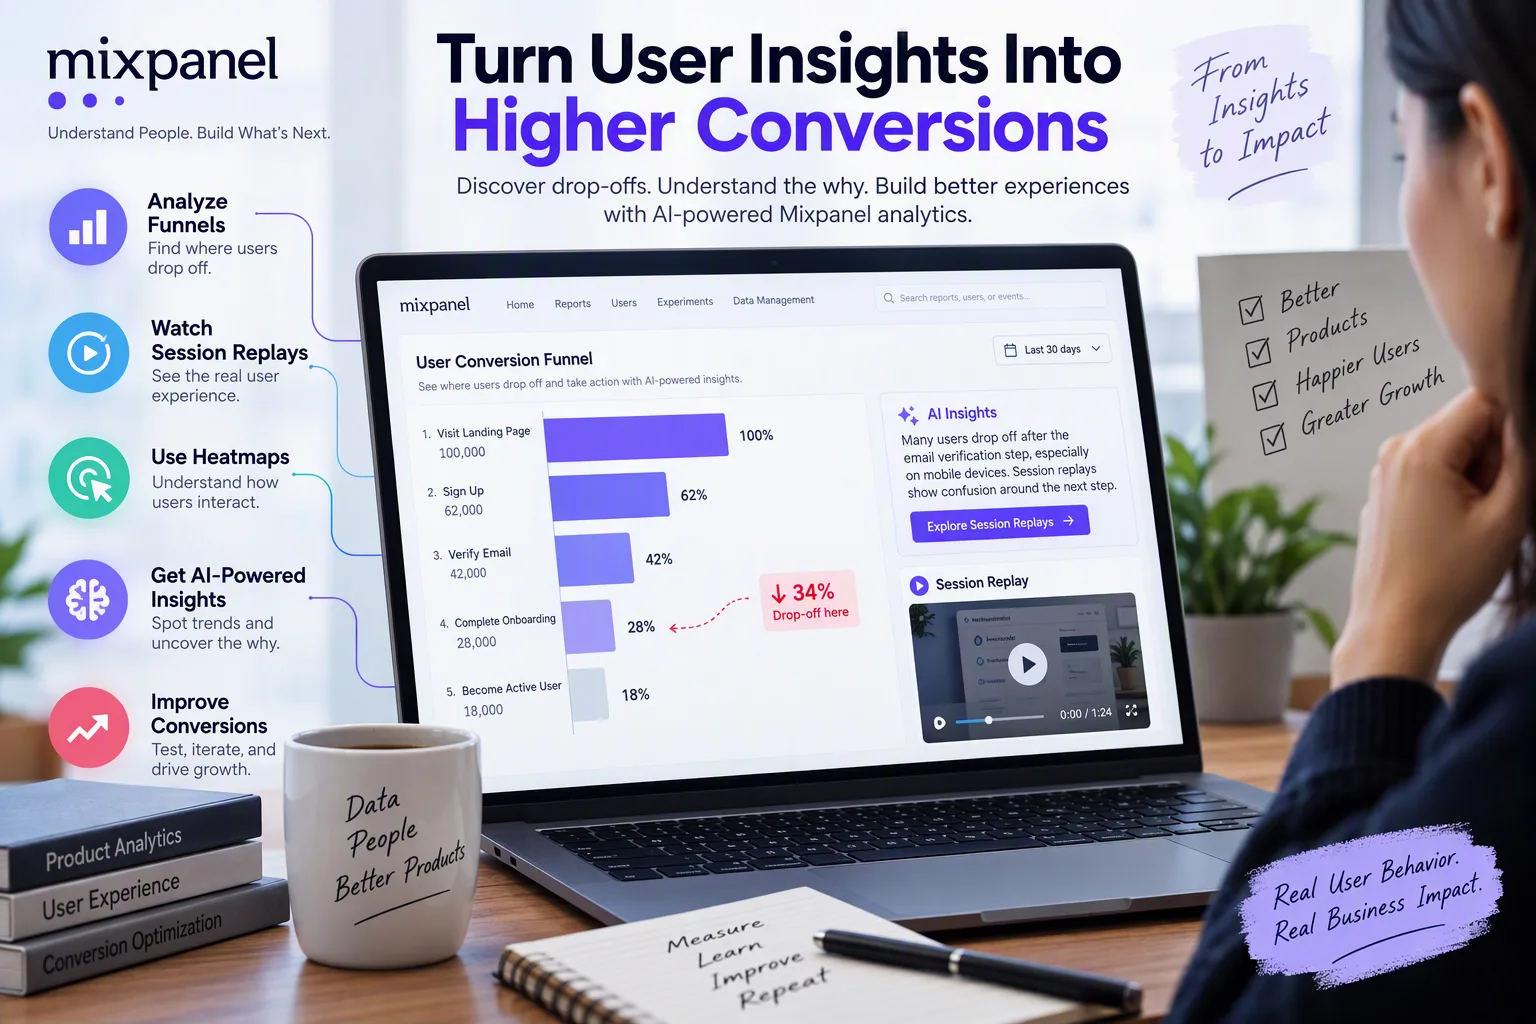
Getting users to visit a website or download an application is only the beginning. The more difficult question is what happens afterward: Do users complete onboarding, activate key features, request a demo, subscribe, or make a purchase?
This is where funnel analysis becomes valuable. Organizations evaluating Mixpanel Analytics Consulting Services in USA, for example, may be trying to understand not simply how much traffic they receive, but which behaviors lead users toward conversion and where friction interrupts the journey.
Modern product analytics is also changing as artificial intelligence becomes integrated into analytics workflows. Mixpanel's current product intelligence approach combines behavioral analytics with capabilities such as funnels, Session Replay, heatmaps and AI-assisted analysis. Its Funnels report is specifically designed to measure conversion through a sequence of events, while Session Replay can connect quantitative drop-off data with recordings that provide qualitative context.
The result is an important shift: teams can move from asking“Where did users leave?” to investigating“What behaviors or product experiences might explain why they left?”
What Is Funnel Drop-Off?
A conversion funnel is simply a sequence of actions that users are expected to complete.
For a SaaS platform, a funnel might look like:
Visit pricing page → Start free trial → Create account → Complete onboarding → Use core feature
For e-commerce:
View product → Add to cart → Begin checkout → Enter payment information → Purchase
In Mixpanel, funnels are constructed from tracked events and measure how users progress through a defined series of actions.
Suppose 10,000 users begin an onboarding process:
- 10,000 visit the signup page
- 7,500 start registration
- 6,100 verify their account
- 4,000 complete onboarding
- 3,200 use a core product feature
The largest decline occurs between account verification and completed onboarding.
That is the drop-off point.
But identifying the drop-off is only the first stage. The harder task is determining its cause.
Users might abandon the process because:
- the form is too long,
- an interface element is confusing,
- a page performs poorly on a particular device,
- instructions are unclear,
- users encounter an error,
- the next step does not appear relevant,
- or the product asks for too much information too early.
Traditional funnel reports reveal the numerical pattern. Behavioral data, replay analysis and AI-assisted investigation can help teams explore the context surrounding that pattern.
Where AI Changes Funnel Analysis
A common analytics challenge is not a shortage of data. It is the amount of time needed to investigate it.
A product with thousands or millions of users can produce an enormous number of behavioral events. Analysts therefore need to determine which segments, paths or sessions deserve closer attention.
In its current platform, Mixpanel describes AI as a way of reducing manual analysis while keeping insights grounded in an organization's product data. The platform also combines analytics with Session Replay and heatmaps so teams can move between aggregate behavior and individual experiences.
This creates a workflow such as:
Measure → Detect → Segment → Investigate → Form hypothesis → Test → Measure again
AI primarily helps accelerate the detection and investigation portions of that cycle. It does not remove the need for human interpretation.
1. Start by Building an Accurate Funnel
AI cannot compensate for fundamentally incorrect tracking.
Before looking for patterns, teams need to define meaningful product events.
Instead of tracking only:
- Page Viewed
- Button Clicked
a useful SaaS implementation might include:
- Signup Started
- Signup Completed
- Email Verified
- Workspace Created
- Integration Connected
- First Project Created
- Subscription Started
Each event can also contain relevant properties such as device type, acquisition channel, plan, browser or product version.
Mixpanel's event-based funnel model then allows the organization to measure conversion through a sequence of those actions.
Practical consideration
Avoid tracking every possible interaction simply because it can be tracked.
Start with events that answer important business and product questions.
For example:
Question: Why is onboarding completion falling?
The corresponding tracking plan should capture the important onboarding stages and enough contextual properties to distinguish meaningful user groups.
Good analytics begins with well-defined questions and reliable data, not AI.
2. Identify the Exact Stage Where Users Drop Off
Once the events are reliable, a funnel can reveal where conversion declines.
Imagine this funnel:
Funnel stageUsersStep conversionSignup started10,000100%Account created8,20082%Email verified7,40090.2%Profile completed4,60062.2%First project created3,90084.8%The profile-completion stage immediately deserves investigation.
However, the correct conclusion is not:
“The profile page is definitely broken.”
The data only tells us where the drop-off occurred.
The next step is diagnosis.
3. Segment the Drop-Off Instead of Looking Only at Averages
Overall conversion rates can hide important differences between users.
For example, suppose profile completion is:
- Desktop: 74%
- Mobile: 45%
The overall funnel might suggest a general onboarding problem. Segmentation would suggest something much more specific: investigate the mobile experience first.
Teams can examine conversion according to dimensions such as:
- operating system,
- browser,
- device type,
- geographic region,
- acquisition source,
- new versus returning user,
- subscription plan,
- application version,
- customer type.
This is where behavioral analytics becomes more actionable.
Example
Imagine an application release is followed by a significant decline in checkout completion.
Instead of immediately redesigning checkout, analysts could compare:
Old app version vs. new app version
If the decline is concentrated among users running the latest Android version of the application, the team has a much narrower hypothesis to investigate.
The objective is to move from:
“Conversion decreased.”
to:
“Conversion decreased primarily among this user group after this particular change.”
That distinction can save substantial investigation time.
4. Connect Funnel Drop-Off With Session Replay
Funnels tell teams what happened at scale. Session Replay can provide context about how users experienced the affected journey.
Mixpanel's Session Replay currently supports web, iOS, Android and React Native, in addition to Electron desktop applications. Its documentation also describes integrations with CDPs such as Segment and mParticle.
Teams can therefore examine sessions associated with particular behaviors instead of manually watching random recordings.
For example:
Funnel finding:
34% of users abandon the payment step.
Replay investigation:
Review sessions belonging to users who started checkout but never completed payment.
Patterns might reveal users:
- repeatedly clicking an element,
- returning to a previous step,
- struggling with a mobile interaction,
- or leaving after encountering a particular experience.
Mixpanel says its current Session Replay capabilities also include AI-generated summaries designed to highlight key moments and patterns, while playlists can be filtered using Mixpanel events, properties and cohorts.
This is particularly useful because watching hundreds of complete sessions manually is rarely practical.
5. Use Heatmaps to Investigate Interface-Level Friction
Not every conversion problem requires studying individual sessions.
Sometimes aggregate interaction patterns provide a better starting point.
Heatmaps can help teams observe patterns such as where visitors interact with a page and which areas receive relatively little engagement. Mixpanel currently positions heatmaps alongside its analytics and Session Replay functionality so teams can move between aggregate behavioral patterns and individual user sessions.
Consider a landing-page funnel:
Landing page → Pricing → Trial signup
Analytics might show unusually low movement from the landing page to pricing.
A heatmap investigation might reveal that visitors are interacting with secondary content while overlooking the primary intended path.
That generates a testable hypothesis:
Is the page hierarchy making the next action difficult to find?
Notice the distinction.
A heatmap does not independently prove why someone behaved in a particular way. Instead, it supplies evidence that can help formulate hypotheses.
6. Ask Behavioral Questions Through AI Interfaces
One of the notable developments in analytics in 2026 is the increasing connection between product data and natural-language AI interfaces.
Mixpanel now documents a hosted Model Context Protocol (MCP) server that can allow compatible AI assistants to access Mixpanel data. Its supported analytics operations include querying events, funnels, flows, retention and Session Replay, as well as discovering project events and properties.
Instead of relying entirely on navigation through reports, an analyst could work with questions conceptually similar to:
Which user segments experienced the largest onboarding decline?
or:
Compare conversion patterns between new and returning users.
MCP is particularly relevant to the broader technology trend of connecting AI systems with governed enterprise tools rather than requiring users to manually move information between interfaces.
However, natural-language access does not make the underlying analysis automatically correct.
A poorly defined event, inaccurate property or ambiguous question can still lead to an incorrect interpretation.
7. Turn AI Findings Into Hypotheses, Not Conclusions
This is one of the most important principles when using AI analytics.
Suppose AI-assisted analysis identifies a common pattern:
Users who fail to complete onboarding frequently leave after reaching the integration screen.
That is useful evidence, but it does not necessarily mean:
The integration screen causes users to abandon onboarding.
There could be another explanation.
For example, users reaching that screen might belong disproportionately to a particular customer segment. Or a recent product update might have affected that group differently.
Think of AI output as:
“Here is a pattern worth investigating.”
rather than:
“Here is definitive proof of causation.”
Human review, controlled experiments and additional evidence are still necessary.
From Funnel Insight to Conversion Improvement
Finding drop-off has little value unless the organization creates a disciplined process for responding to it.
A practical workflow is:
Step 1: Define the conversion
Decide exactly what successful behavior means.
For example:
Signup → Workspace created → First project published
Step 2: Validate instrumentation
Check:
- event names,
- event firing,
- timestamps,
- identity management,
- duplicate events,
- missing properties,
- server-versus-client tracking.
Step 3: Establish a baseline
Measure the funnel before making changes.
Record both:
- overall conversion,
- step-level conversion.
Step 4: Locate significant drop-offs
Determine which transition loses the largest meaningful proportion of users.
Step 5: Segment the affected population
Compare conversion across devices, channels, plans, product versions and other relevant dimensions.
Step 6: Investigate behavior
Use behavioral reports, flows, replay and heatmaps where appropriate.
Current Mixpanel Session Replay can be filtered using behavioral events and properties, helping teams focus their investigation on sessions associated with the issue rather than manually reviewing arbitrary recordings.
Step 7: Form a hypothesis
For example:
Mobile users may be abandoning signup because the verification step creates unnecessary friction.
Step 8: Test the change
Make a controlled change and evaluate whether conversion improves.
Step 9: Measure downstream impact
A higher completion rate is not automatically a better business outcome.
Teams should also examine metrics such as:
- activation,
- retention,
- subscription conversion,
- cancellations,
- revenue,
- feature adoption.
Removing an onboarding step might increase signup completion but result in less qualified or less activated users.
A Practical Example: SaaS Onboarding Drop-Off
Consider a B2B SaaS company with this funnel:
Create account → Verify email → Add company details → Connect data source → Create first dashboard
Analytics detects that many users leave at Connect data source.
Initial observation
The team shouldn't immediately remove the integration step.
Instead, it could segment affected users.
Analysis reveals the drop-off is disproportionately high among first-time users.
Behavioral investigation
Relevant Session Replays are reviewed to understand what happens during the integration experience.
Analysts notice that many unsuccessful sessions involve repeated navigation between the integration screen and documentation.
Hypothesis
Users may not have the technical information required to configure the integration during their first session.
Potential experiment
The team could test an onboarding option such as:
“I'll connect my data later.”
Users could first explore the product using a sample dataset and configure their real integration afterward.
Measurement
The team would then compare:
- onboarding completion,
- data-source connection,
- activation,
- retention,
- paid conversion.
This is a better approach than optimizing onboarding completion alone because it asks whether the change produces meaningful product adoption.
Data Quality Still Determines AI Quality
AI analytics creates another challenge: convincing-looking answers can make incorrect instrumentation harder to notice.
Imagine that a Purchase Completed event fires twice for some transactions.
An AI system analyzing that event does not automatically know the implementation is wrong.
Similarly:
signup_complete
Signup Completed
registration_complete
Show more lines
could describe the same business event but appear as three separate events in analytics.
Before relying heavily on AI-assisted analysis, organizations should establish:
- event naming conventions,
- property definitions,
- identity-management rules,
- documentation,
- data-quality monitoring,
- ownership for analytics changes.
Mixpanel's current MCP documentation even exposes tools for finding data-quality issues, searching events and properties, and identifying potentially duplicate event/property names, reflecting the broader importance of data governance in AI-assisted analytics.
AI can accelerate analysis, but it cannot turn inconsistent tracking into reliable evidence.
Privacy Matters More With Session Replay and AI
Behavioral analytics can collect sensitive information if it is implemented carelessly.
This is especially important with Session Replay because recordings can potentially capture content displayed on a user's device.
Mixpanel states that Session Replay masks inputs, text and images by default, while its implementation documentation recommends careful testing of masking, edge cases and rollout strategies.
Teams should still independently determine:
- which events genuinely need to be collected,
- whether event properties contain personal information,
- which screens should be recorded,
- what should remain masked,
- how long data should be retained,
- which employees should access it,
- whether appropriate user consent is required,
- which regulatory obligations apply.
Privacy should therefore be part of analytics architecture, not something added after implementation.
Sampling Is Another Important Technical Decision
Recording every user session is not necessarily appropriate.
For web implementations, Mixpanel provides configurable Session Replay sampling and recommends testing implementation carefully before adjusting recording levels for production requirements. Its documentation also supports manual start and stop controls for cases requiring a more selective capture strategy.
A practical approach might therefore record:
- a representative percentage of ordinary sessions,
- selected journeys needing investigation,
- sessions associated with specific behavioral criteria,
subject to the organization's privacy and consent requirements.
The right sampling strategy depends on traffic volume, investigation objectives, cost, privacy obligations and how representative the resulting sample needs to be.
Current Technology Trend: Analytics Is Moving Toward AI-Assisted Product Intelligence
The technological direction in 2026 is broader than simply adding a chatbot to an analytics dashboard.
Analytics platforms are increasingly combining:
Structured events + behavioral journeys + visual interaction data + experimentation + AI interfaces
Mixpanel's current platform illustrates this movement. It combines quantitative behavioral analytics with Session Replay and heatmaps, while its MCP implementation allows compatible AI assistants to query funnels, flows, retention and related analytics data.
For product and analytics teams, this potentially changes the amount of manual work involved in moving from a problem to a useful hypothesis.
Previously, the workflow might require:
Dashboard → segment analysis → separate replay product → manual session review → spreadsheet → hypothesis
An increasingly integrated workflow can be:
Funnel → segment → relevant replays → AI-assisted summary → hypothesis → experiment
The underlying objective remains the same: understand user behavior using credible evidence.
Benefits of AI-Powered Funnel Analysis
When appropriately implemented, AI-assisted product analytics can offer several practical advantages.
Faster investigation
AI can help analysts narrow large datasets or replay collections to potentially useful patterns. Mixpanel's current Session Replay product includes AI-generated replay summaries intended to surface key moments without requiring every replay to be watched in full.
Better connection between quantitative and qualitative evidence
Funnels quantify where users leave, while replay and heatmap information can provide additional behavioral context.
More accessible analytics
Natural-language interfaces can make some analytical tasks accessible without requiring every stakeholder to learn the complete reporting interface. Mixpanel's MCP server, for example, supports natural-language interaction with events, funnels, flows, retention and other project information through compatible AI clients.
More targeted experimentation
Instead of redesigning an entire journey, teams can use behavioral evidence to identify a narrower problem and test a focused change.
Limitations Teams Should Understand
AI does not remove the fundamental weaknesses of analytics.
1. Correlation is not causation
Users dropping out after an event does not prove that event caused the abandonment.
2. Poor instrumentation produces poor analysis
Incorrect events, missing properties and identity-resolution problems can distort findings.
3. AI summaries remove detail
A summary is useful for prioritization but can miss nuances visible in the original session.
4. Sampling can create blind spots
Session Replay represents only captured sessions when sampling is used. Analysts should therefore avoid treating a replay sample as automatically representative of every user.
5. Privacy requirements remain
AI does not eliminate responsibilities relating to collection, access, masking, retention or consent.
6. Business context is still essential
An analytics system may recognize a behavioral pattern without understanding why a particular segment, feature or workflow matters strategically.
The safest principle is:
Let AI accelerate investigation, but let evidence and controlled testing guide decisions.
Questions to Ask Before Implementing AI-Powered Funnel Analytics
Whether an organization manages analytics internally or evaluates Mixpanel Analytics Consulting Services in USA, the technical questions should come before tool configuration.
Ask:
- What precisely counts as conversion?
- Which events represent meaningful user behavior?
- Are events and properties consistently defined?
- How are anonymous and authenticated identities handled?
- Which funnel segments need comparison?
- Which Session Replay information should be masked or excluded?
- What consent requirements apply?
- How will AI-generated findings be validated?
- Can suspected improvements be tested experimentally?
- Are downstream retention and business outcomes being measured along with conversion?
These questions help prevent teams from confusing sophisticated analytics technology with reliable decision-making.
Final Thoughts
AI-powered Mixpanel analytics can make funnel investigation more efficient by connecting conversion data with segmentation, Session Replay, heatmaps and increasingly natural-language analytical workflows. Current capabilities such as event-based Funnels, AI-assisted replay analysis and MCP-based access illustrate how product analytics is becoming more integrated and conversational.
But technology does not replace analytics fundamentals.
A successful conversion-optimization process still begins with accurate tracking, a clearly defined funnel and reliable data. AI can help uncover patterns faster, but those patterns should become hypotheses rather than automatic conclusions.
The most practical approach is therefore straightforward:
Measure the journey → identify drop-off → segment the problem → investigate behavior → create a hypothesis → test the change → measure the long-term result.
When this process is followed consistently, funnel analytics becomes more than a report showing where users disappeared. It becomes a structured way to understand friction, prioritize product improvements and make conversion decisions based on observable user behavior.