2025 closed off as the third costliest year in terms of climate related losses and continually rising greenhouse gas emissions increase the severity and frequency of damage causing, severe weather events. Past exposure to weather elements will also impact climate losses as infrastructure weakens and wear and tear increases over time. A potential Super El Nino condition could further amplify catastrophic weather events as ocean and ground temperature averages push past the 1.5 C threshold. Climate change and its effects can be considered a constant in the current environmental landscape and the negative impacts on business are felt across every industry and category. Businesses and especially the insurance industry can use technology and data analytics to assess climate risk and past exposure to make better and more profitable business decisions. ClimAIteTRACK from TTS delivers region specific, data driven climate assessments to help businesses strategize within the current economic and environment landscape.
An Analytics Tool for the Insurance Industry
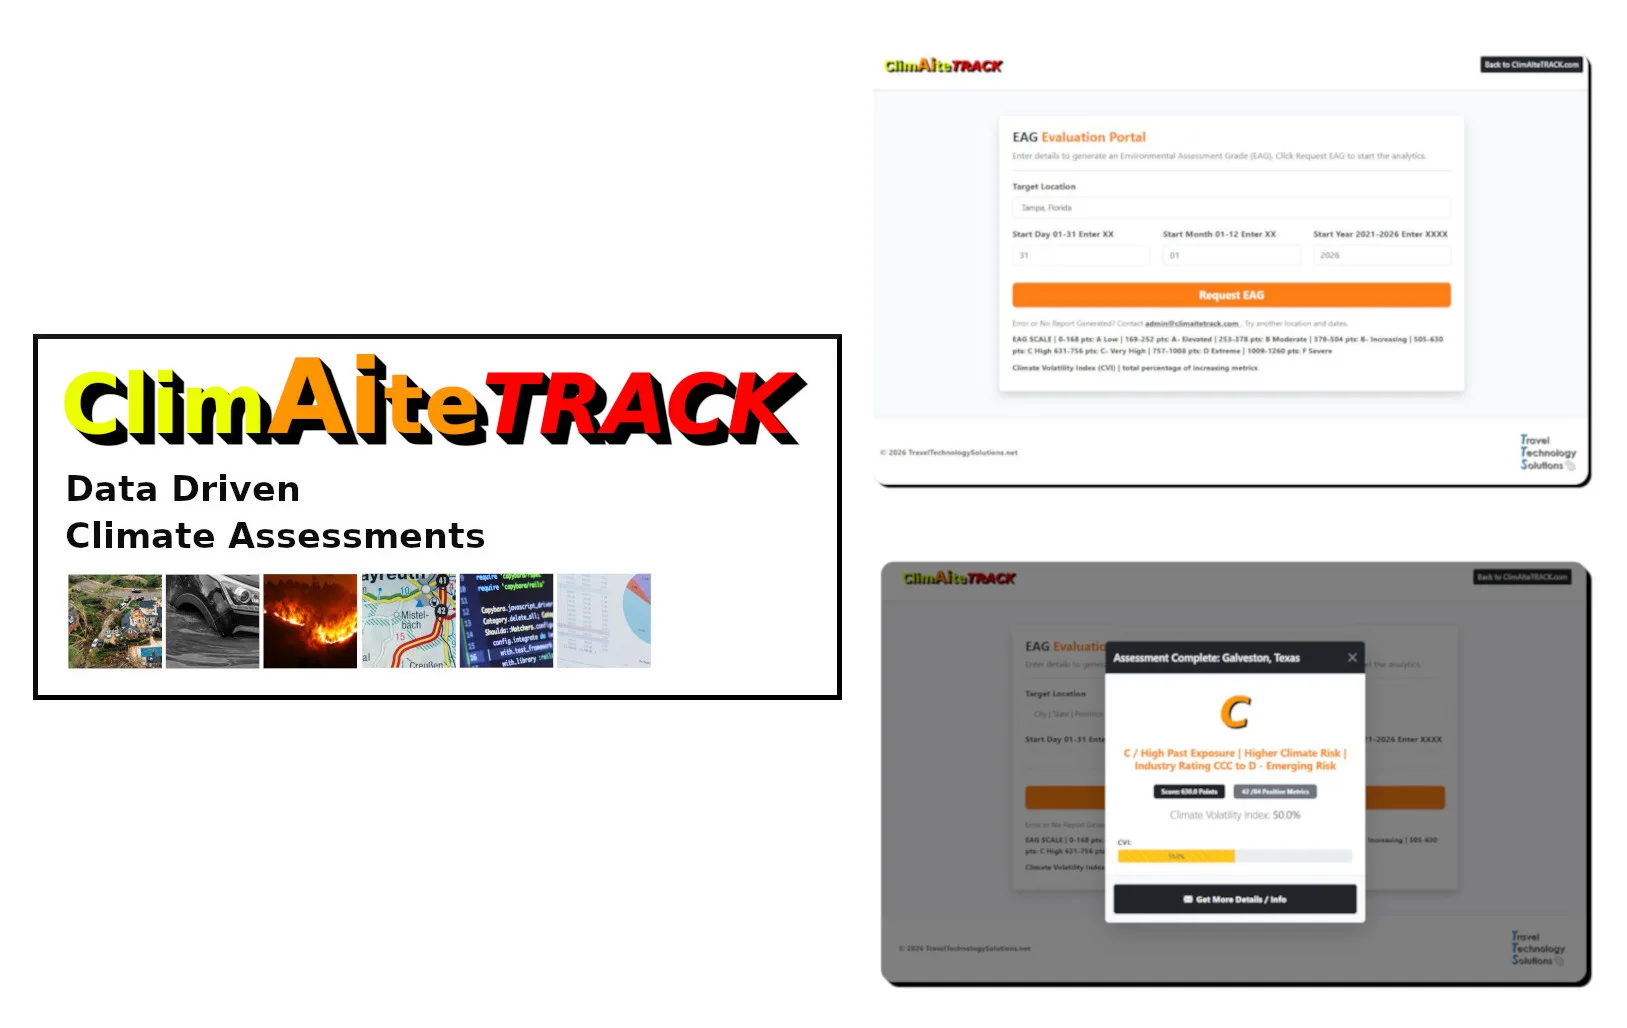
Introducing ClimAIteTRACK, a new insurance management tool that delivers 2 distinct and significant benefits to the industry. Behind the scenes, ClimAIteTRACK is a powerful data analytics tool that automates many different processes to generate an Environmental Assessment Grade (EAG) and Climate Volatility Index (CVI) for any specific location in the world. After acquiring current and historical weather data spread across 15 different metrics, ClimAIteTRACK goes to work and performs multiplied layered calculations and comparative analysis to determine the EAG and CVI. Data handling and ‘cleaning’ is automated to ensure all measuring units and slots are qualified and accurate results are generated. EAGs consist of a letter grade, A-F and the CVI is percent based on the number of increasing metrics. With the current evaluation, the EAG and CVI are prominently displayed on screen but ClimAIteTRACK is designed to handle and process output data and can create or write to documents when vertically integrated into an insurer’s own system.

Revenue Management Through Data Driven Assessments
ClimAIteTRACK has dual roles within the insurance industry but its core function is to strategize premium revenue increases through data analytics. ClimAIteTRACK and EAG reporting can be used on a yearly basis as the client’s policy renewal approaches. Generating an EAG at this time is a typical application as clients would expect premium changes at renewal. Using the EAG as a reference point, insurance companies can adjust premiums upwards and within a defined threshold based on the final EAG and CVI results. The Dynamic Premium Pricing Model function within ClimAIteTRACK offers a dynamic product for higher risk areas or special needs clients. Using DPPM automates the process and premium adjustments can occur on a bi-monthly, quarterly or bi-annual basis resulting in higher net premium revenue when using percentages to base the price increase. Both analytic modes offer methodology and data to raise premiums and increase premium income over different time intervals.
Building Stronger Client Relationships
The second function for ClimAIteTRACK is its user facing capabilities. By generating different marketing elements, insurers can convey messaging to their clients and offer transparency when premium adjustments occur. Graphical elements such as scoring grids, grades and commentary, graphs and other dynamic resources can be integrated into bills and invoices or displayed online for users to access. Offering transparency and information in the current environmental landscape can help clients understand and accept new premium rates or changes in terms to their policies. While no consumers want price increases, keeping clients informed and up to date on their specific climate assessment can keep those relationships strong over the longer term. ClimAIteTRACK elements work across both commercial and residential portfolios and are ideally suited for business insurance markets.
The 2nd Generation of ClimAIteTRACK
The latest version of ClimAIteTRACK is now online and available for evaluation. The 2nd generation of the technology includes numerous upgrades including:
- Expanded weather metric elements
- Increases reference years from 5 to 7
- Additional analytics and comparison layers
- More precise scoring and grade lettering
- Implementation of the Climate Volatility Index (CVI)
- Updated bootstrap portal for a cleaner visuals and a better user experience
The next evolution of ClimAIteTRACK will see implementation of the DPPM function and reporting and static data loading functions for batch report processing and grading. Access ClimAIteTRACK at the Evaluation Portal and get an ‘EAG’ for any location. Watch a short demonstration video of the technology here: https://youtu.be/-JfbRLM0qnI