Table of Content
- Introduction
- What are candlestick patterns
- Why candlestick patterns matter
- Types of candlestick patterns
- Bullish candlestick patterns
- Bearish candlestick patterns
- Neutral candlestick patterns
- How to use candlestick effectively
- Common mistakes beginners make
- Conclusion
- FAQs
Introduction
An understanding of price action is essential in trading or investing. Although novice investors are glued to the use of trading indicators and news headlines, veteran traders find it more effective to use the price action approach when making informed trading decisions. Among the most effective techniques used in understanding price action is the use of candlestick patterns.
Candlesticks are graphical depictions of market sentiment or behaviour over time that demonstrate buyers’ and sellers’ activity for any particular time period. No matter what instrument you are trading in—stocks, indexes, commodities, or foreign exchange—studying Japanese candlesticks can help optimize your timing in trading. For beginners, studying candlesticks at the best share market institute in Pune could be helpful to improve their timing.
Within this article, we will provide an explanation on candlestick patterns that is easy to understand and can be applied by anyone, whether they are experienced or new to trading.
What Are Candlestick Patterns?
Candlestick patterns are different patterns created by one or more than one candlesticks on a price chart. They show the trend in the market as well as give indication about the upcoming moves in the market. Each of the candlestick is made of four data points related to the price action:
- Open Price
- Close Price
- High Price
- Low Price
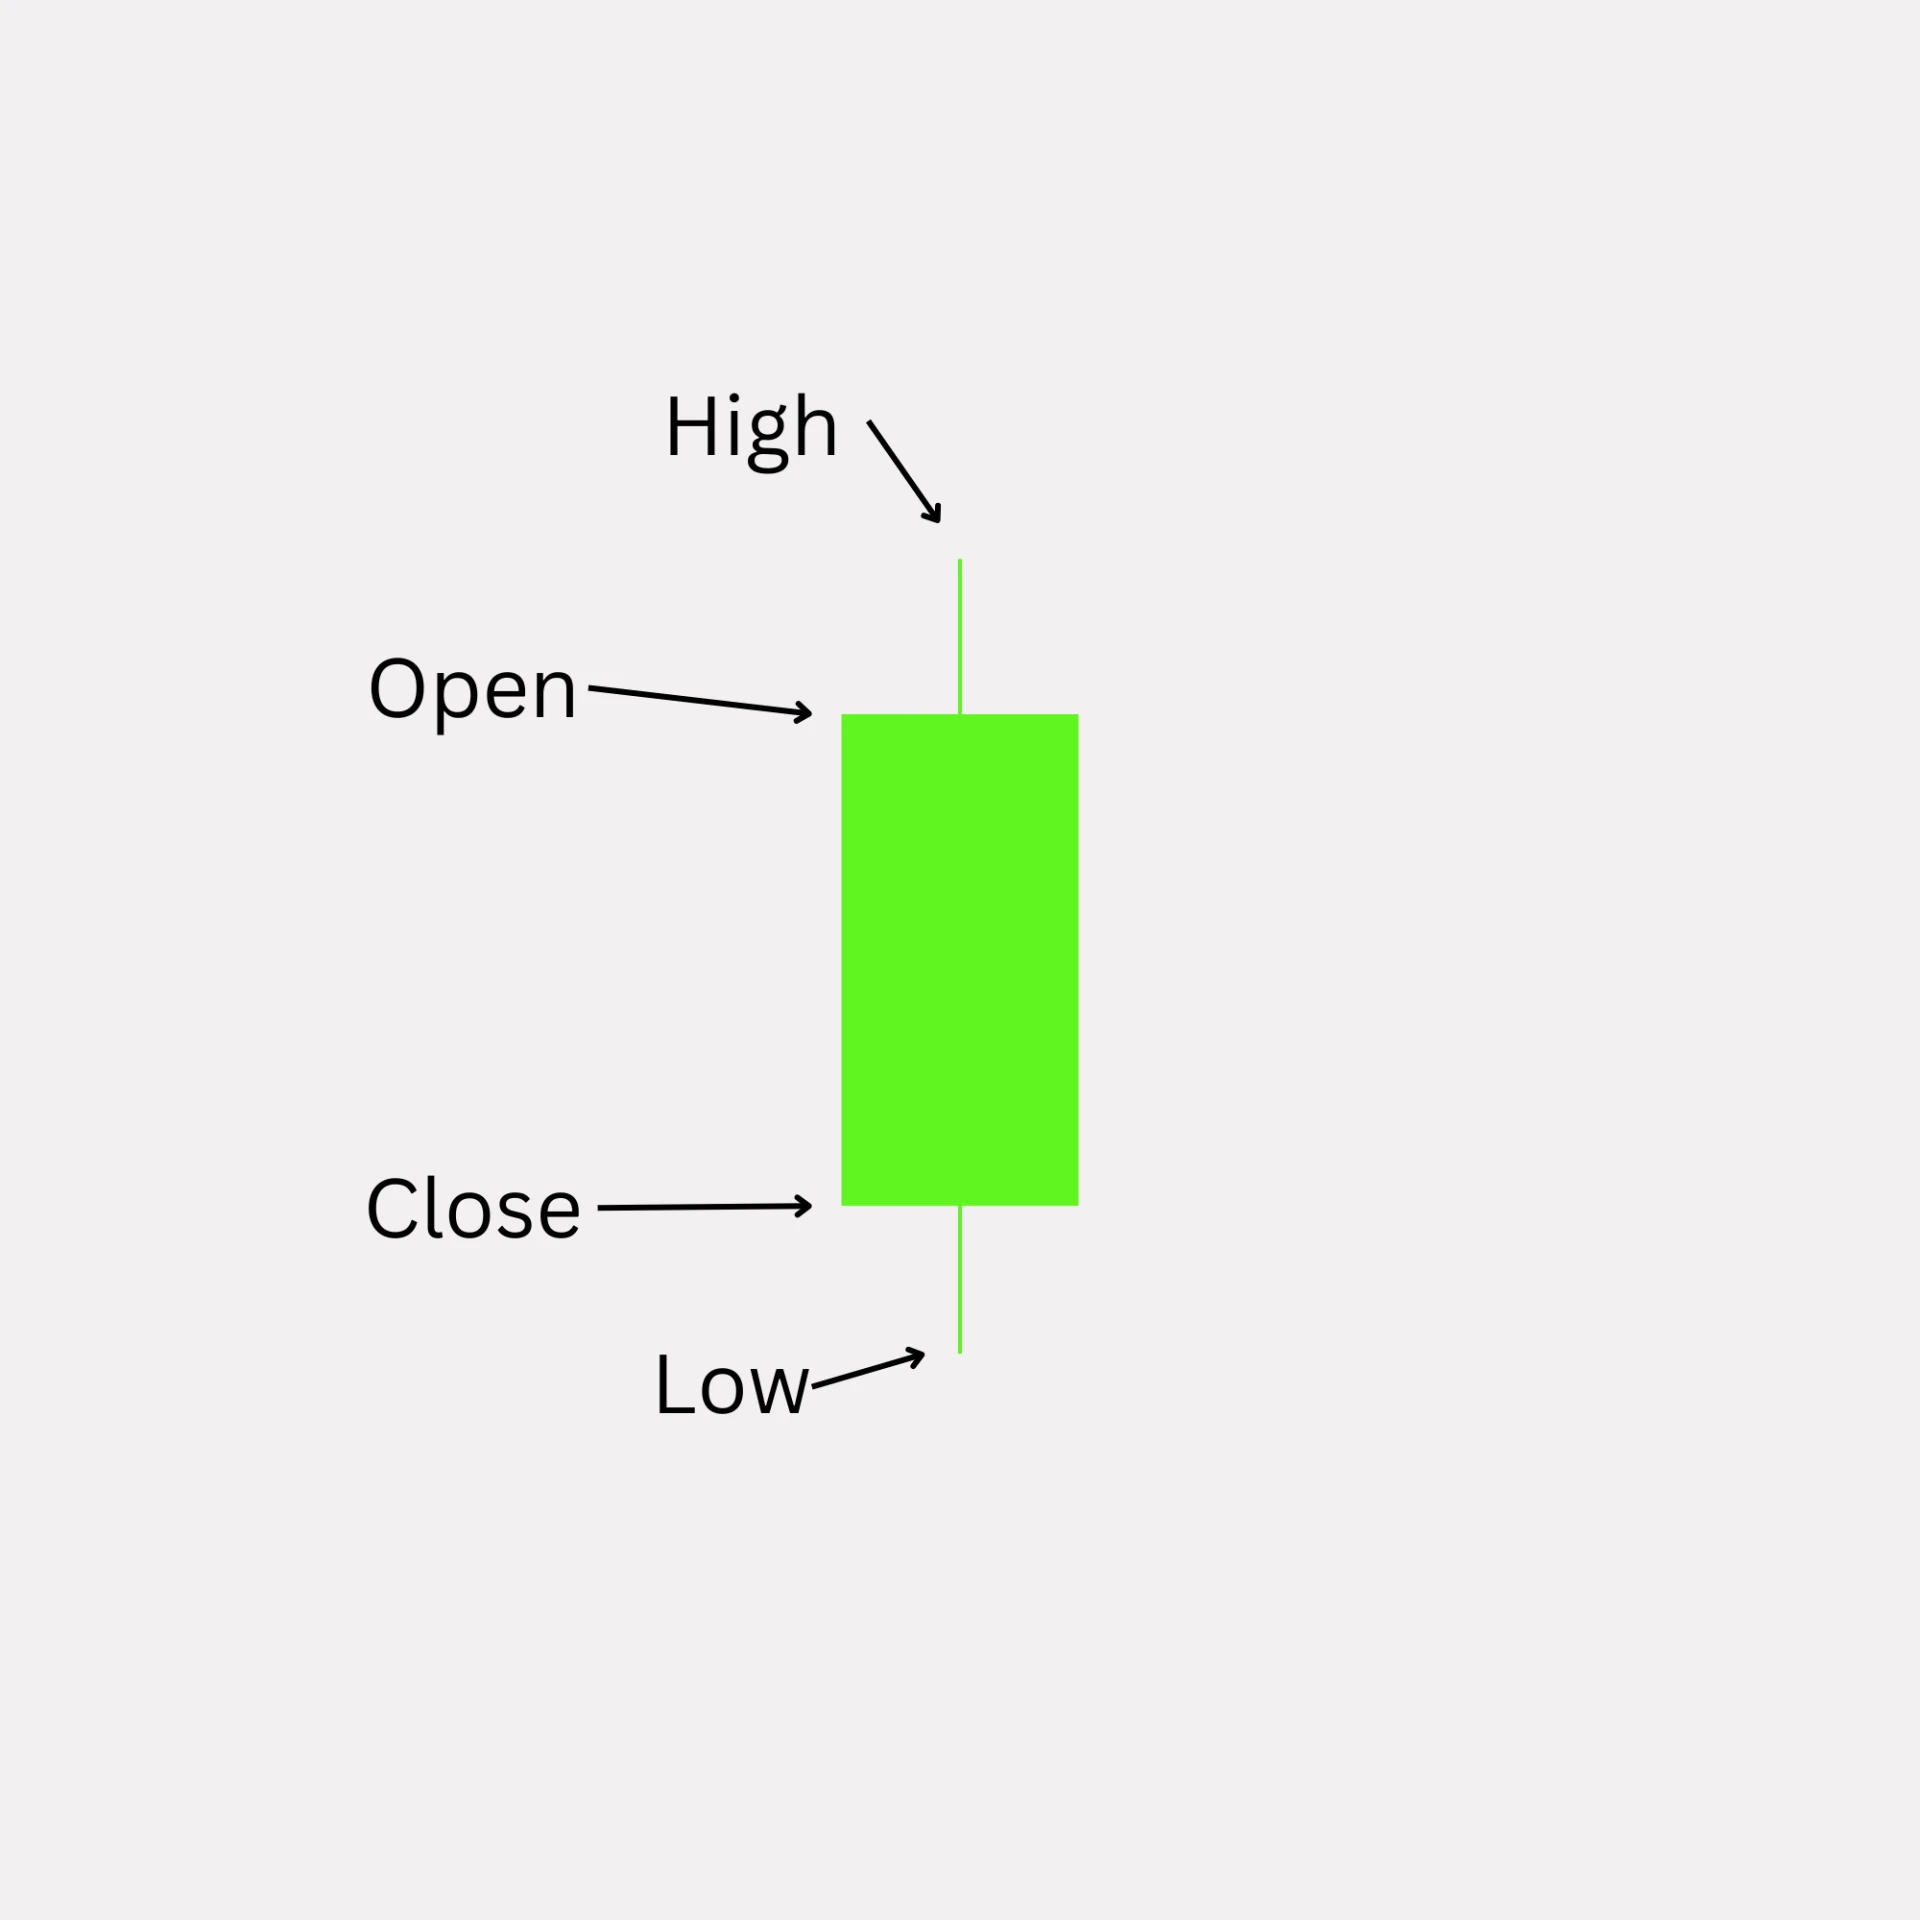
Structure of a Candlestick
Candlestick has two components: body and shadow.
Body: This is the portion that marks the close and open position on a candlestick.
Shadow: Thin lines that are commonly referred to as the wicks of the candle. These are the high and low of the candlestick.
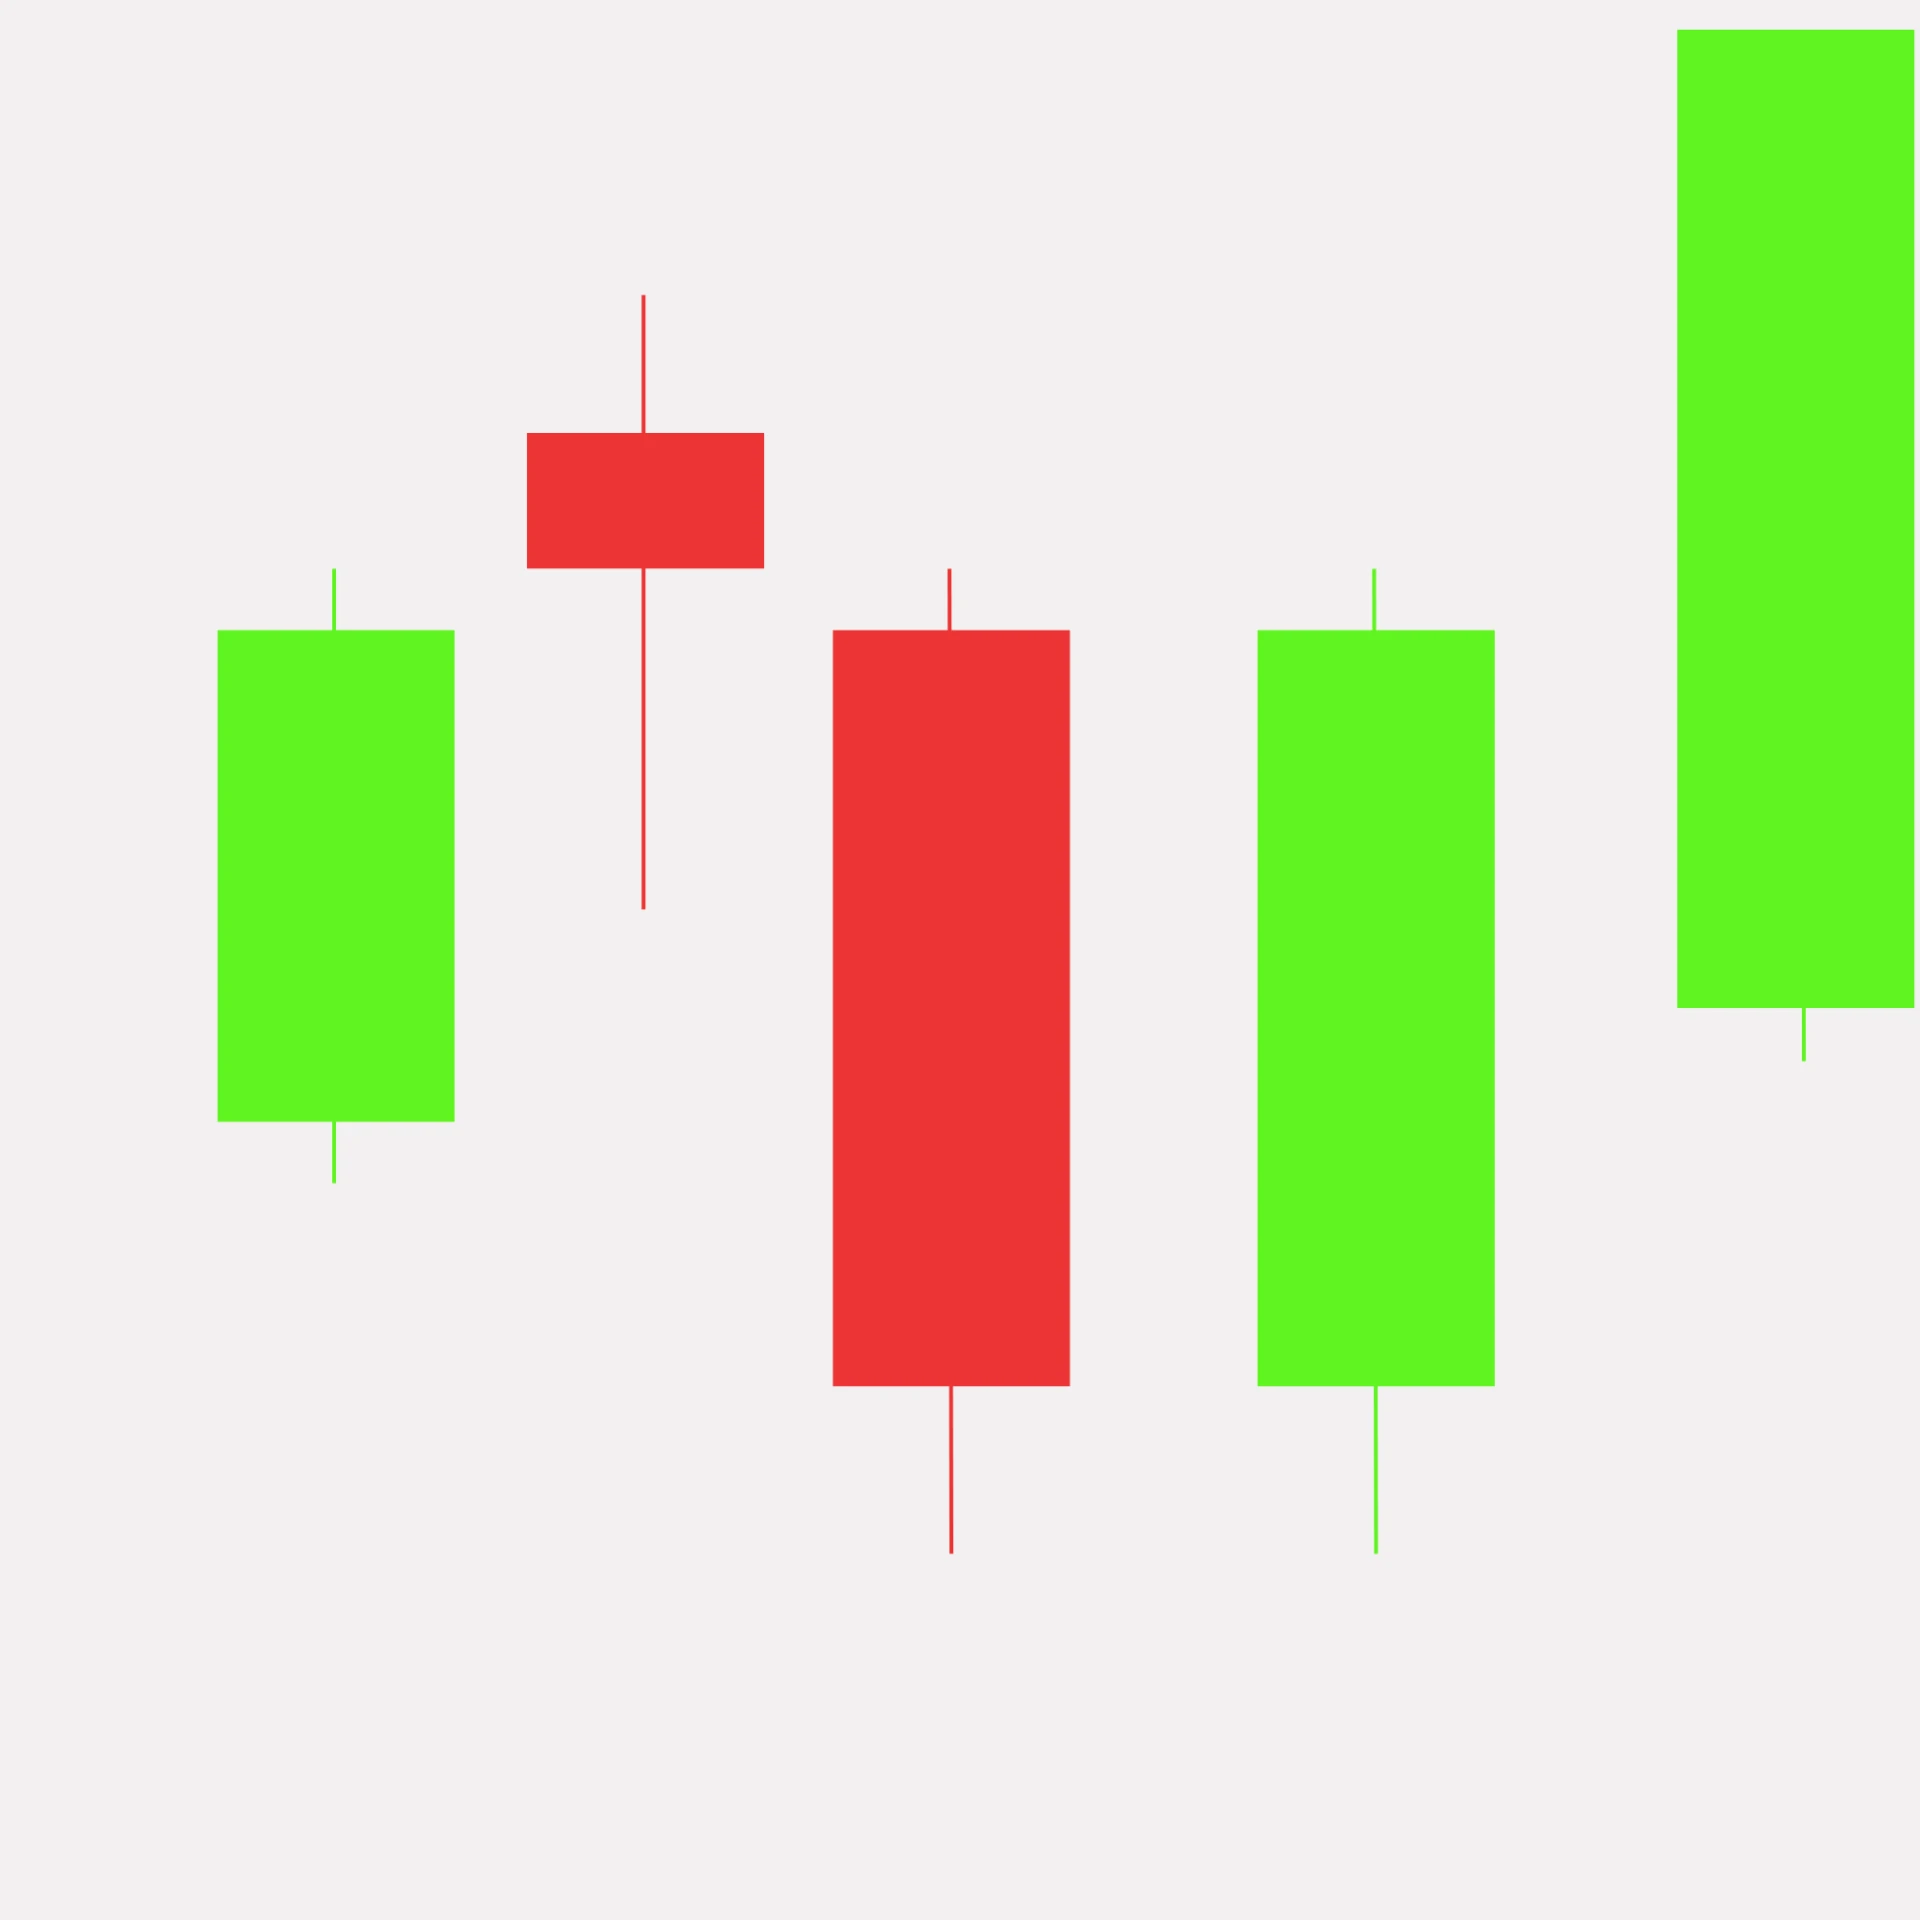
Colour: For a bullish graph, the colour will be green/white. For a bullish graph, the 'Close' will be greater than the 'Open' price.
A bearish candle is depicted in red/ black color. In a bearish candle, the close price is lower than the open price. Using the candlestick pattern techniques, the traders are able to identify whether the market condition is at the indecision phase, bullish trend phase, and bear market phase.
It assists the traders in comprehending the trend reversals and trend continuation.
Why Candlestick Patterns Matter
Candlestick patterns have popularity among traders because they:
- Are easy to spot visually
- Work across all timeframes
- Reflect real market emotions like fear and greed
- Can be combined with indicators for higher accuracy
Instead of predicting the future, candlestick patterns help traders react intelligently to what the market is already showing.
Types of Candlestick Patterns
Candlestick patterns are broadly classified into three categories based on position of candlesticks:
- Bullish Patterns – Indicate potential upward movement
- Bearish Patterns – Indicate potential downward movement
- Neutral Patterns – Indicate indecision or consolidation
Common Bullish Candlestick Patterns
1. Hammer
- Small body at the top with a long lower wick
- Appears after a downtrend
- Indicates buyers are stepping in
Meaning: Possibility of trend reversal becomes much higher whenever a hammer pattern occurs in the chart.
2. Bullish Engulfing
- A large bullish candle completely covers the previous bearish candle
- Signals strong buying pressure
Meaning: Buyers are more powerful than sellers and dominate the market now.
3. Morning Star
- A three-candle pattern
- First candle: bearish
- Second candle: small body
- Third candle: strong bullish
Meaning: Downtrend is likely ending.
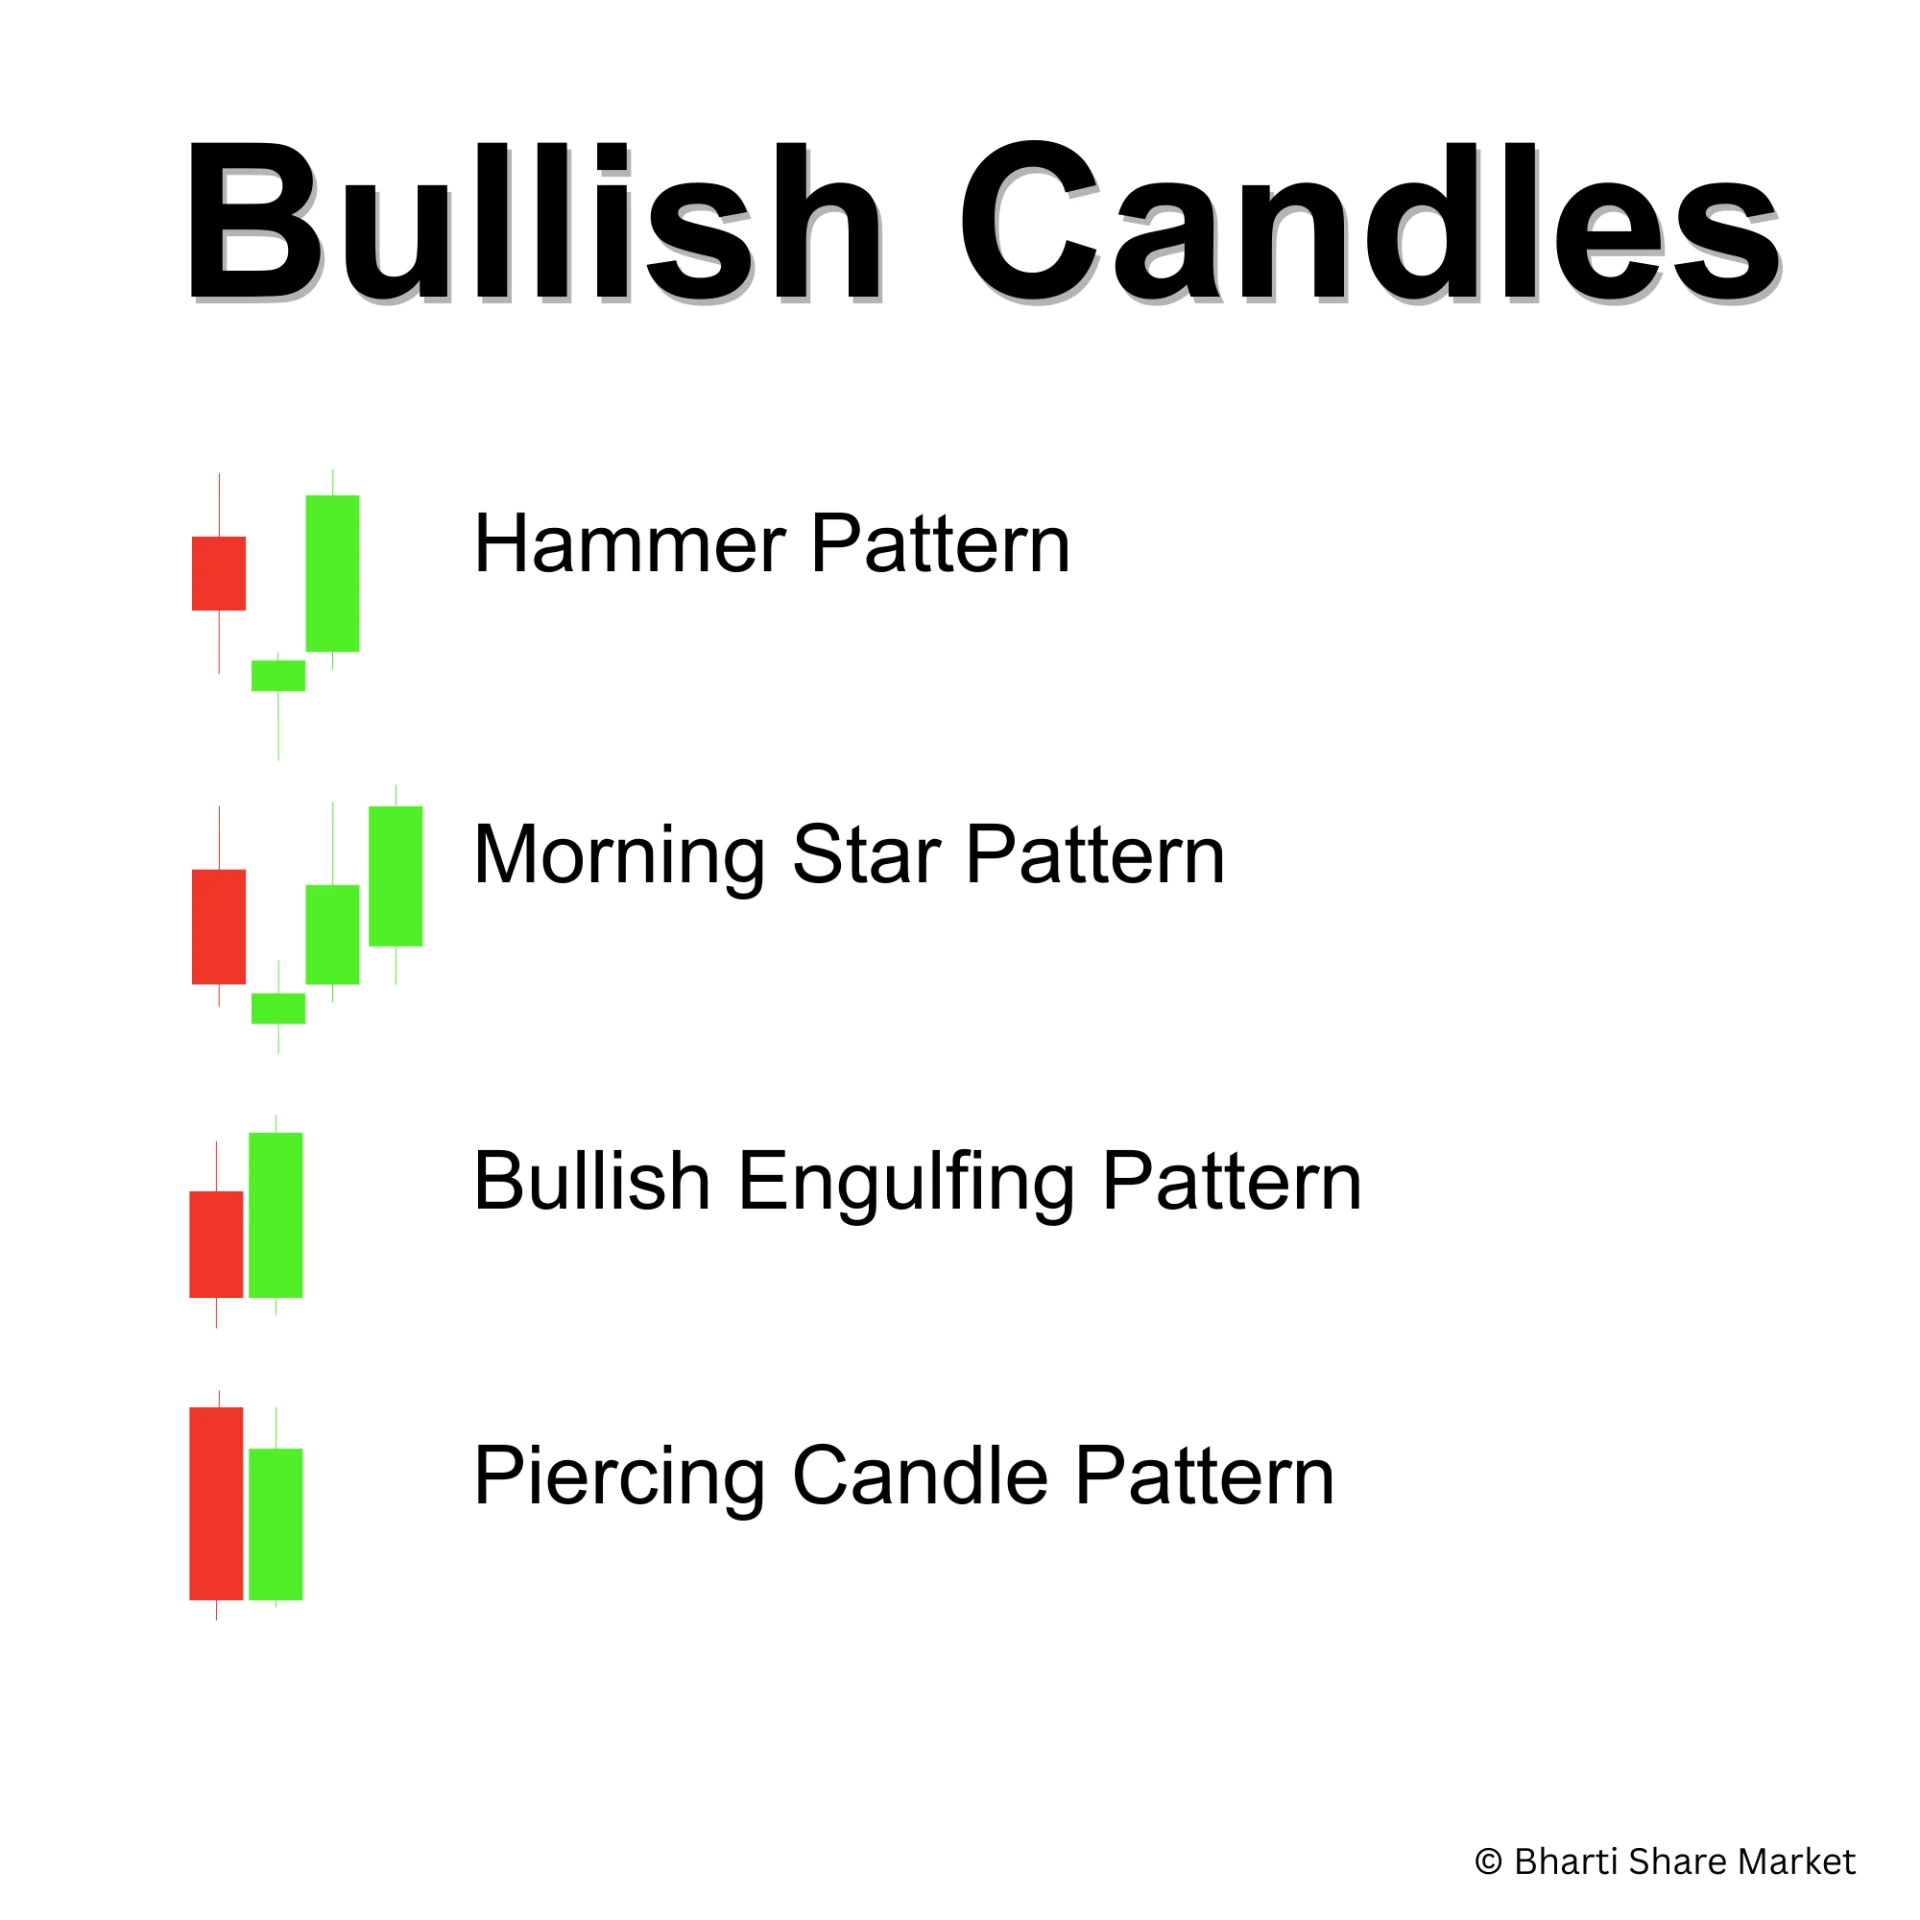
4. Piercing Pattern
- A bullish candle follows a bearish candle and closes above the midpoint of the bearish candle.
Meaning: Selling pressure is decreasing and buying sentiment is increasing.
Common Bearish Candlestick Patterns
1. Shooting Star
- Small body at the bottom with a long upper wick
- Appears after an uptrend
Meaning: Buyers failed to push prices higher.
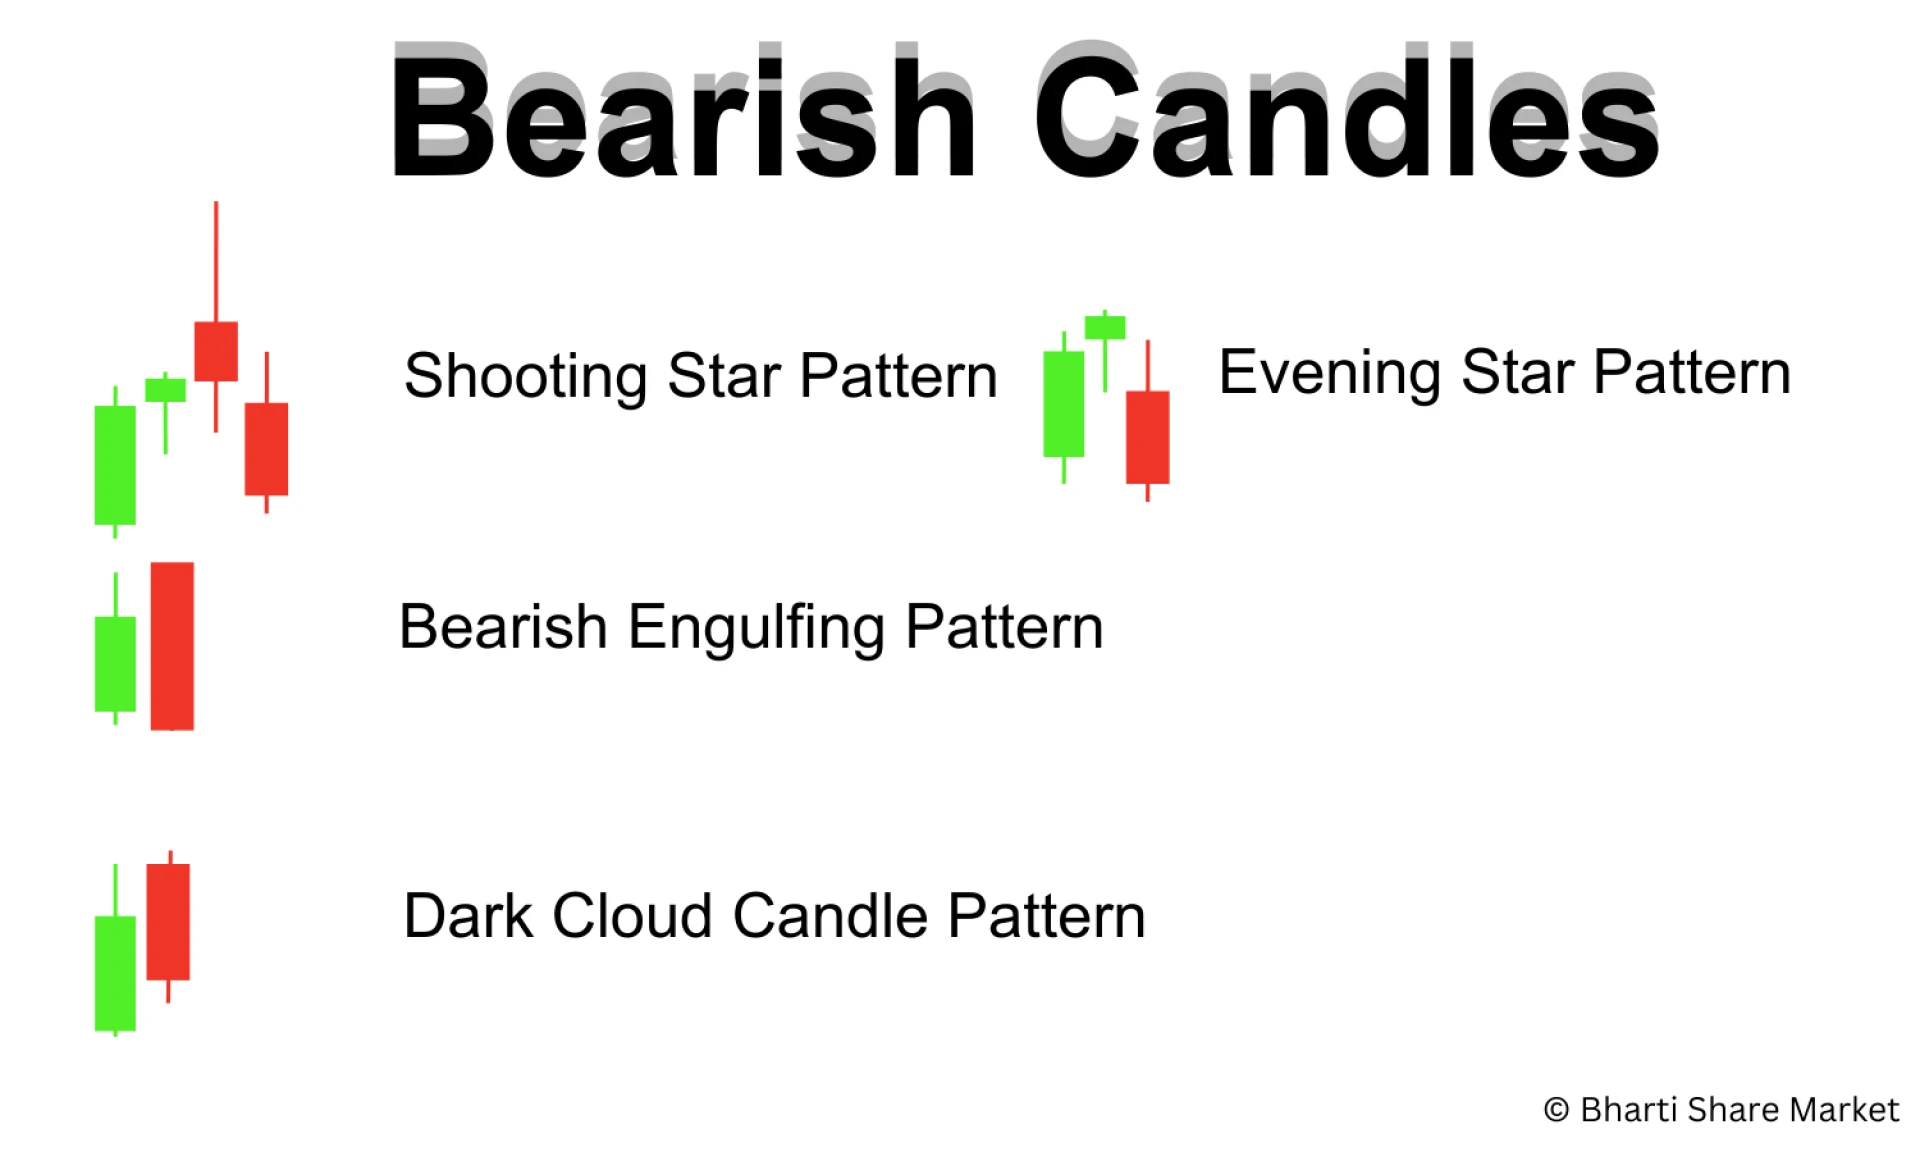
2. Bearish Engulfing
- Large bearish candle engulfs the previous bullish candle
Meaning: Sellers have overpowered buyers.
3. Evening Star
- Opposite of Morning Star
- Indicates the end of an uptrend
Meaning: Possible market reversal downward.
4. Dark Cloud Cover
- Bearish candle closes below the midpoint of the previous bullish candle
Meaning: Selling pressure is increasing.
Neutral Candlestick Patterns
1. Doji
- Open and close prices are almost the same
- Looks like a cross or plus sign
Meaning: Market indecision; potential reversal if confirmed.
2. Spinning Top
- Small body with long wicks on both sides
Meaning: Buyers and sellers are equally strong.
How to Use Candlestick Patterns Effectively
1. Always Consider the Trend
Candlestick patterns work best when used with the overall trend. A bullish pattern in an uptrend is more reliable than one in a sideways market.
2. Use Confirmation
Never trade on a pattern alone. Wait for:
- Next candle confirmation
- Support or resistance levels
- Volume increase
3. Combine with Indicators
Use indicators like:
- Moving Averages
- RSI
- MACD
This improves the probability of success.
4. Practice Risk Management
- Always use stop-loss
- Risk only a small percentage of capital per trade
- Avoid over-trading
Common Mistakes Beginners Make
- Trading every candlestick pattern without confirmation
- Ignoring market trend
- Over-leveraging positions
- Expecting 100% accuracy from patterns
Remember, candlestick patterns might increase probability, not certainty.
Candlestick Patterns for Indian Markets
Candlestick patterns work exceptionally well in:
- NSE & BSE stocks
- NIFTY & BANK NIFTY
- MCX commodities
- Currency markets
Indian markets often respect support, resistance, and price action, making candlestick analysis a valuable skill for traders and investors alike.
Conclusion
Candlestick patterns are a very effective method of interpreting market action. These patterns depict the ongoing battle between the bulls and bears of the market. They assist the trader in taking the right decision.
For a new trader, learning a number of basic patterns in candlestick analysis is much more useful than learning a long list of complex indicators. Used in the right way, with trend analysis, and with due caution, candlestick patterns can be a big help in improving trading precision and accuracy. New traders should join share market classes in Hadapsar to get a better understanding of all related patterns to make right decisions.
Look, consistency and practice are the true keys to success in the stock market.
Disclaimer: Investment in the Stock market is subject to market risk. There is no assured returns in the Stock market so invest as per your risk appetite and read all the documents carefully before investing.
FAQs
Q1. What are the most popular bullish candlestick patterns?
A1. The most popular bullish candlestick patterns are hammer, bullish engulfing, morning star and piercing pattern.
Q2. Which are the well known bearish candlestick patterns?
A2. The well known bearish patterns for candlestick are shooting star, bearish engulfing, evening star, dark cloud cover.
Q3. Does candlestick pattern work in Indian markets?
A3. Yes, candlestick patterns work very well in the Indian market whether it is NSE or BSE stocks, NSE Nifty Futures, BSE Futures, Options or commodities.