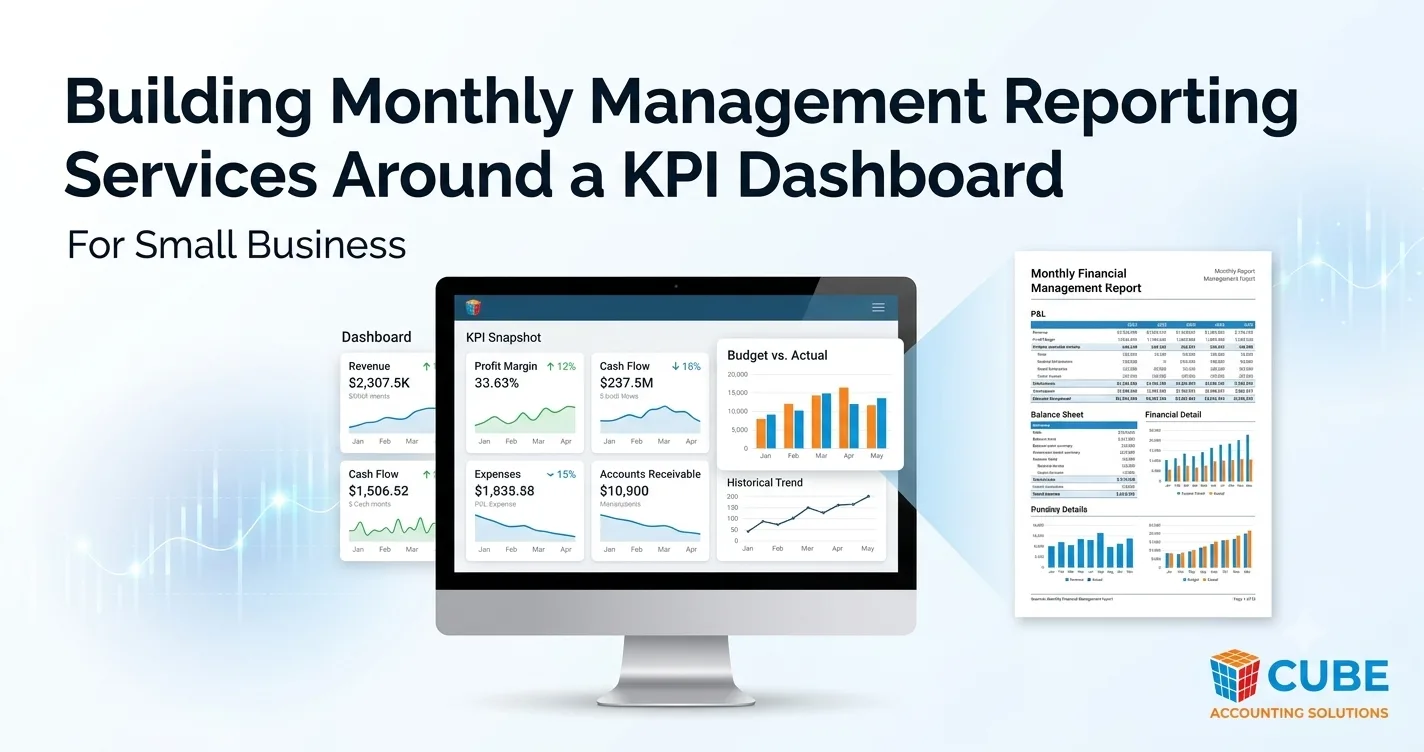
Small businesses often have plenty of financial data but still struggle to see what that data means. Accounting systems may contain revenue, expenses, invoices, bills, payroll, and cash information, but business owners need a practical way to turn those numbers into useful decisions.
A KPI dashboard can provide a quick view of the numbers that matter most. Monthly management reporting can then add the financial detail and explanation behind those numbers.
When these two tools are designed to work together, management can get both a quick snapshot and a deeper understanding of business performance.
What Are Monthly Management Reporting Services?
Monthly Management Reporting Services provide business owners and managers with regular financial information about how the company performed during a specific period.
A monthly management report may include:
- Revenue and expenses
- Profit and loss results
- Balance sheet information
- Cash flow
- Accounts receivable
- Accounts payable
- Budget versus actual results
- Changes in major expenses
- Profit margins
- Financial trends
The purpose is not simply to produce another financial report. The information should help management understand what happened during the month and decide what may need attention.
For example, if revenue increased but profit decreased, management may want to know why. The monthly report can help identify whether higher payroll, operating costs, material costs, or other expenses contributed to the change.
What Role Does a KPI Dashboard Play?
A KPI dashboard focuses on a smaller number of important measurements.
KPI means Key Performance Indicator. These are measurements that help management monitor areas that are important to the business.
KPI Dashboard Reporting for Small Business can provide a quick view of selected indicators such as:
- Revenue growth
- Gross profit margin
- Net profit margin
- Cash balance
- Accounts receivable
- Sales activity
- Customer retention
- Operating expenses
- Recurring revenue
- Sales pipeline
The dashboard should not attempt to show everything. Its purpose is to make important information easier to see and review.
Why Build Monthly Reporting Around a Dashboard?
A dashboard can show that something changed, but it may not explain why.
Suppose a company's gross margin falls from 42% to 35%. The dashboard can make the change easy to spot.
Management may then need to look at the monthly financial report to understand what caused the decline.
Perhaps:
- Product costs increased.
- Prices were reduced.
- A particular customer became less profitable.
- Labor costs increased.
- A large project had unexpected expenses.
The dashboard identifies the issue. The monthly reporting provides more of the context.
This makes the two systems complementary rather than competing.
Start With the Business Questions
Before creating reports or choosing KPIs, management should decide what questions the reporting process needs to answer.
For example:
- Are we making enough profit?
- Is revenue growing?
- Are expenses increasing too quickly?
- Do we have enough cash?
- Are customers paying on time?
- Which products or services are most profitable?
- Are we meeting our budget?
- Are sales strong enough to support planned growth?
The answers help determine which information belongs on the dashboard and which information should remain in the detailed monthly report.
Choose KPIs That Support Decision-Making
A common mistake is putting too many measurements on a dashboard.
More information does not always mean better information.
A small business may only need a handful of KPIs that directly relate to its goals. The right selection will depend on the industry and business model.
For example, a professional services company might monitor:
- Revenue
- Billable utilization
- Gross margin
- Accounts receivable
- New clients
- Client retention
A retail business may care more about:
- Sales
- Gross margin
- Inventory turnover
- Average transaction value
- Customer traffic
- Inventory levels
The dashboard should be designed around the decisions management needs to make, not simply around the information that happens to be available in the accounting system.
Connect the Dashboard to Monthly Financial Reporting
Once the KPIs have been selected, the next step is connecting them to the broader reporting process.
For example, a monthly reporting package might include:
1. Executive KPI Dashboard
This provides a quick overview of the most important measurements.
2. Profit and Loss Statement
This shows revenue, expenses, and profitability for the reporting period.
3. Balance Sheet
This provides information about assets, liabilities, and equity.
4. Cash Flow Information
This helps management understand where cash came from and where it went.
5. Budget Comparison
Actual results can be compared with the company's budget to identify meaningful differences.
6. Management Commentary
A short explanation can highlight major changes, unusual results, and issues that may require attention.
This structure allows management to start with the dashboard and then move into greater detail when necessary.
Use Variance Reporting to Explain Changes
A dashboard may show that actual results differ from expectations. Variance reporting can help explain the difference.
For example, a business may have budgeted $100,000 in monthly revenue but generated $85,000.
The important question is not simply that revenue was $15,000 below budget. Management needs to understand why.
The difference could result from:
- Fewer sales
- Delayed projects
- Lower prices
- Seasonal demand
- Customer cancellations
- Delayed billing
SMB budgeting and variance reporting can help management identify these differences and determine whether they require action.
Add Cash Flow Visibility
Profit and cash are not the same thing.
A business can report a profit while still experiencing a cash shortage because customers have not paid invoices, inventory purchases have increased, or large payments are due.
The KPI dashboard might display the current cash balance and accounts receivable. Monthly reporting can provide more detailed information about the factors affecting cash.
Cash flow forecasting for small business can also add a forward-looking view by estimating expected cash inflows and outflows.
This gives management three useful perspectives:
- What happened?
- What is happening now?
- What may happen next?
Keep the Reporting Process Consistent
A useful reporting system should follow a consistent schedule.
For example, after the accounting period closes, the business can:
- Review and reconcile accounting records.
- Complete the monthly close.
- Prepare financial statements.
- Update the KPI dashboard.
- Compare results with the budget.
- Review important variances.
- Add management commentary.
- Discuss findings and possible actions.
Consistency makes it easier to compare one month with another.
It also reduces the risk of making decisions based on incomplete or inconsistent information.
Do Not Make the Dashboard Too Complicated
A dashboard should make information easier to understand, not create another layer of complexity.
Too many charts, metrics, colors, and measurements can make it difficult to identify what actually matters.
A good dashboard should answer important questions quickly.
For example, management should be able to identify:
- Whether revenue is moving in the expected direction
- Whether profitability is improving or declining
- Whether cash requires attention
- Whether major expenses are outside expectations
- Whether important business targets are being met
Detailed explanations can remain in the monthly reporting package.
Review the Dashboard as the Business Changes
The right KPIs today may not be the right KPIs a year from now.
A small business may initially focus on sales growth and cash. As it becomes larger, management may need more attention on margins, customer profitability, employee costs, locations, departments, or working capital.
The reporting process should therefore be reviewed periodically.
A KPI that no longer helps management make decisions can be removed. A new measurement can be added when the business develops a new priority.
How Cube Accounting Solutions Can Help
Cube Accounting Solutions provides accounting, tax, and Fractional CFO services for businesses from its Santa Ana, California location while serving businesses across the U.S.
Its financial management services can support businesses that need organized financial reporting, KPI tracking, budgeting, cash flow forecasting, and management-level financial information.
The specific reporting structure should depend on the business's size, industry, accounting systems, and management needs. Some businesses may need a simple dashboard, while others may benefit from a more detailed monthly reporting package built around the dashboard.
Final Thoughts
A KPI dashboard and monthly financial reporting serve different purposes, but they can work very well together.
The dashboard gives management a quick view of important performance indicators. Monthly reporting provides the financial detail needed to understand changes, investigate problems, and make better decisions.
The goal is not to produce as many reports as possible. It is to build a reporting process that gives business owners the right information at the right time and makes that information easier to act on.