
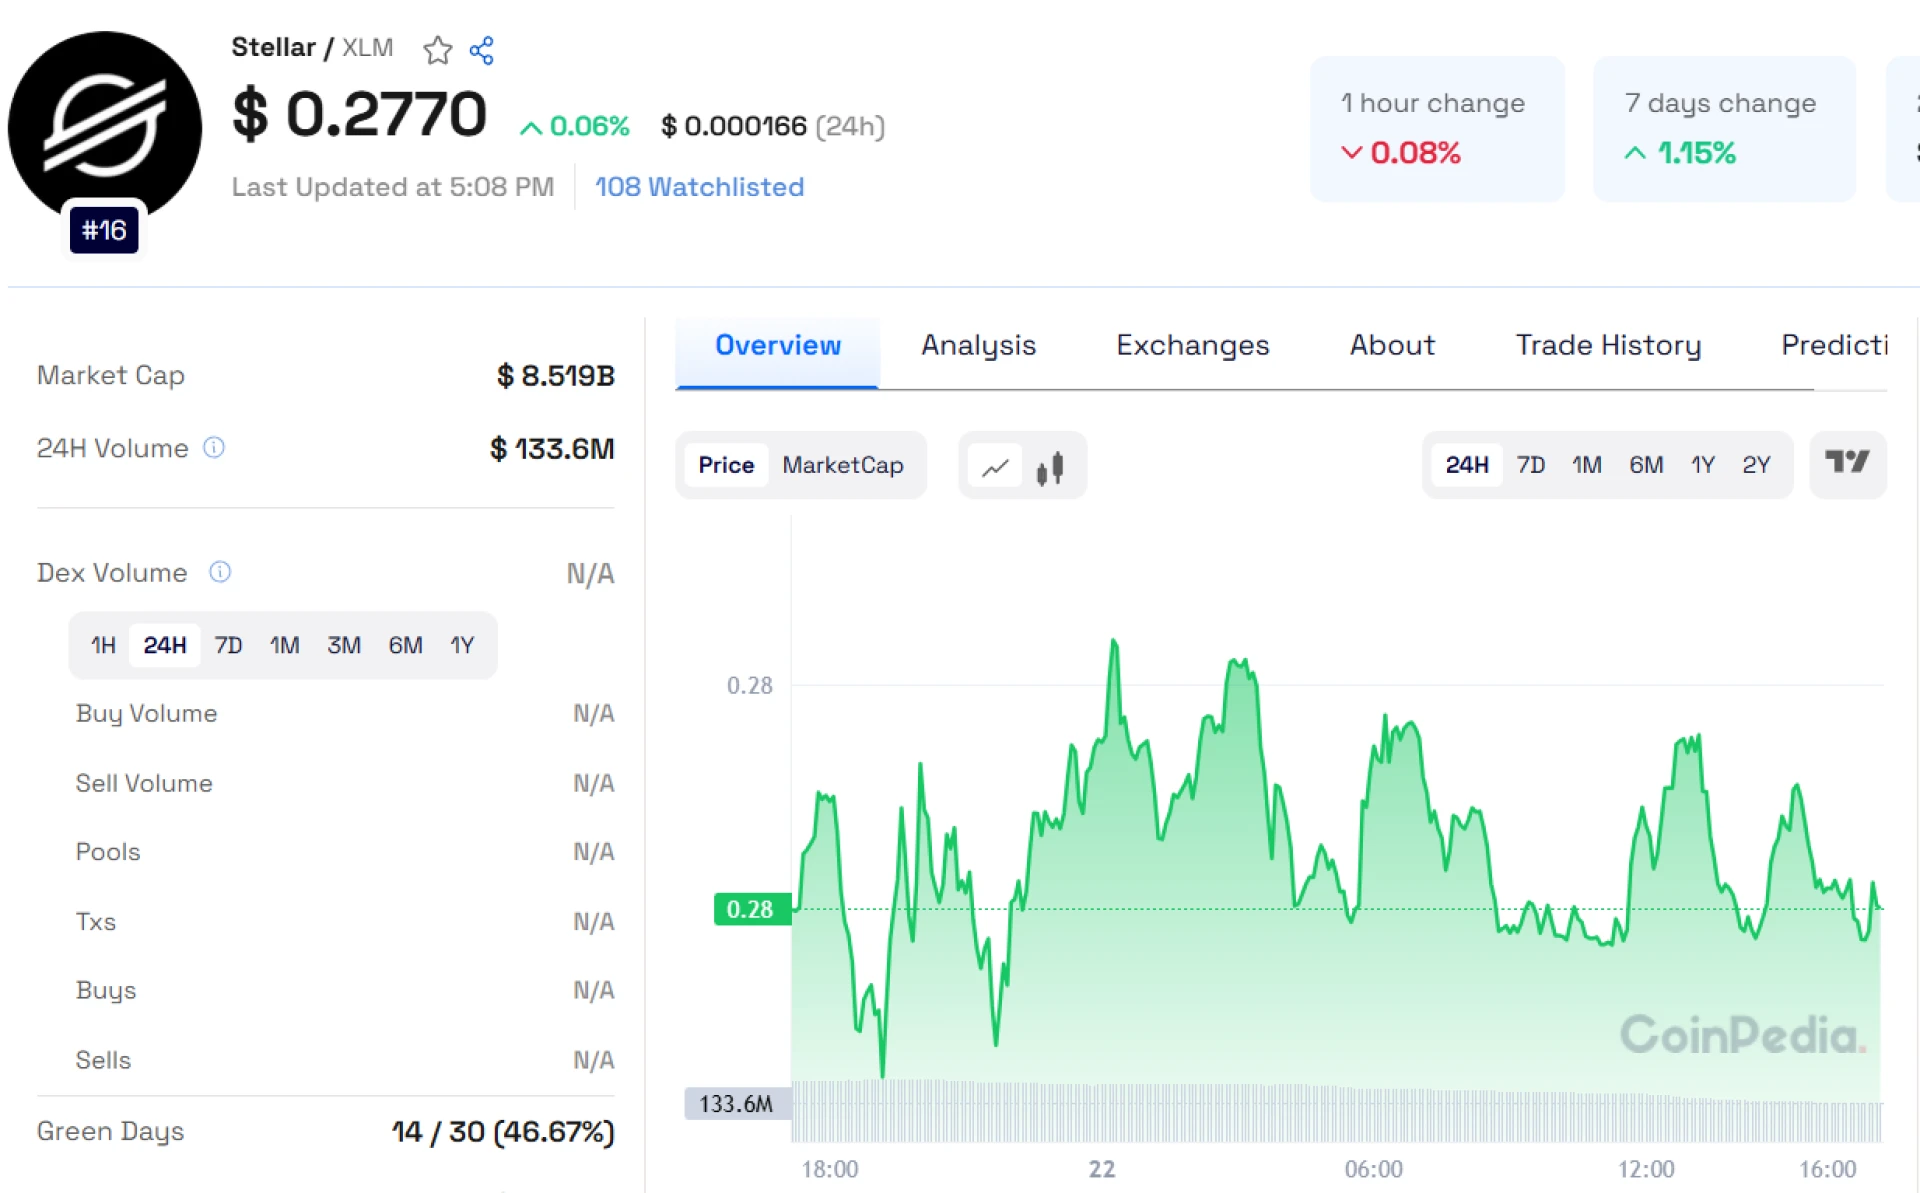
 Stellar Lumens (XLM) is currently at a pivotal moment, facing strong resistance below the 200 Exponential Moving Average (EMA). The 15-minute chart shows a sharp rejection from this level, reinforcing downward pressure, while the 1-hour chart confirms a decisive break below the uptrend line, indicating growing selling pressure. XLM is now clinging to the crucial support level of $0.2770, which could determine its next significant move.
Read Stellar Price Prediction for more detailed insights
Bearish Scenario: Will XLM Break Support?
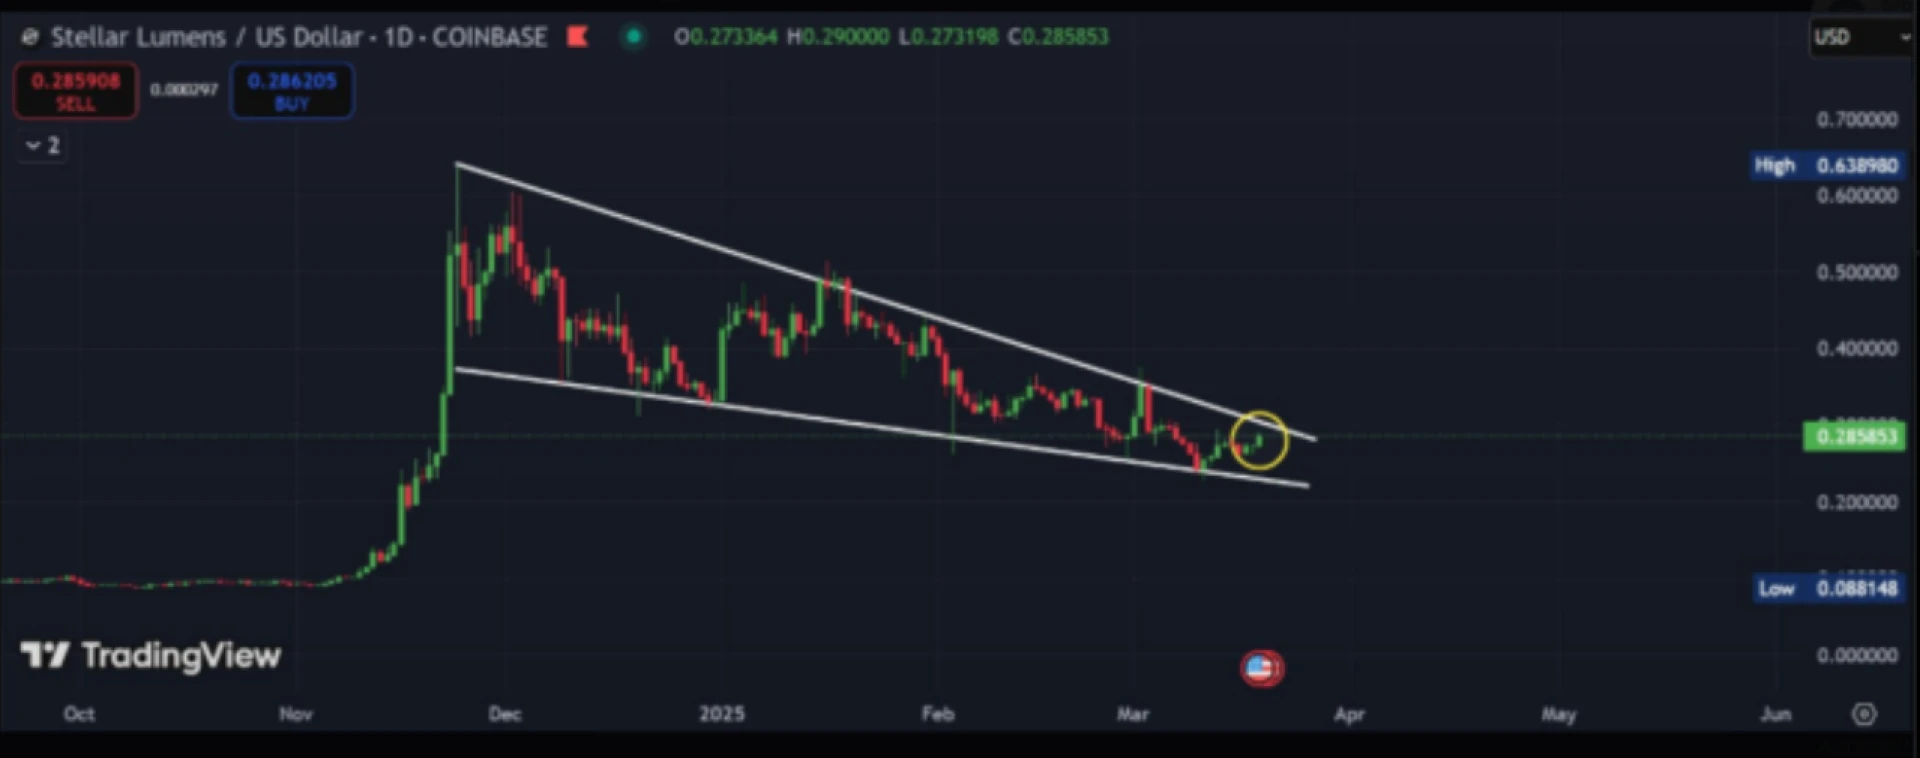
The $0.2770 support level has been tested multiple times, signaling potential weakness. If XLM fails to hold this level, a decline toward $0.2612 could follow. A break below $0.2620 might trigger a deeper correction, shaking market confidence. Notably, TheBlockBull highlighted that XLM has been forming a falling wedge pattern for over 115 days—a historically bullish pattern that often results in an upside breakout.
Bullish Potential: Signs of Accumulation?
While the falling wedge suggests a bullish reversal, another analyst pointed out that XLM is also forming a rounding bottom pattern, which indicates a shift from selling pressure to accumulation. If confirmed, this could pave the way for a sustained uptrend. VipRoseTr emphasized the need for volume confirmation before going long, as strong buying interest would signal further upside potential.
Also Read: Jupiter Price Prediction 2025, 2026 – 2030: Will JUP Price Hit $2?
Key Resistance and Market Sentiment
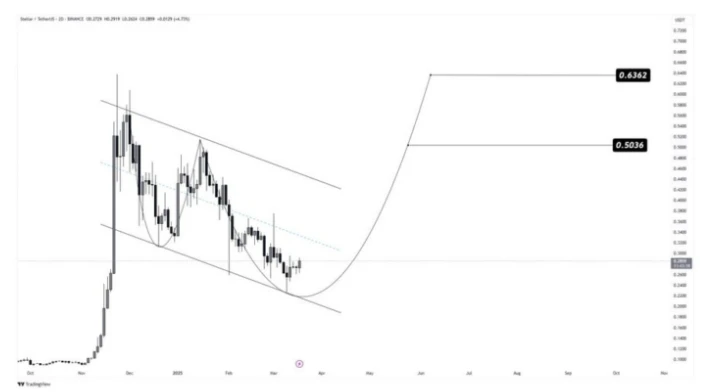
For XLM to confirm a breakout, it must overcome resistance at $0.294. A successful move above this level could push the price toward $0.315, with further targets at $0.5036 and $0.6362.
At press time, XLM is trading at $0.2879, up 7.18% in 24 hours. With broader crypto market strength and an unchanged Federal Reserve interest rate outlook, XLM may have a chance for recovery despite being 70.46% below its all-time high of $0.94 from April 2021.