To truly understand how Minitab training can improve your analysis, one must look beyond the interface and into the shift it creates in analytical rigor. While many professionals use spreadsheets for basic data logging, Minitab is a specialized statistical engine designed to handle the complexities of industrial-grade data.
In the fast-evolving landscape of 2026, where data volume is increasing exponentially, the ability to perform precise, validated analysis is what separates high-performing organizations from the rest. Professional training ensures you aren't just clicking buttons, but applying the correct statistical logic to real-world problems.
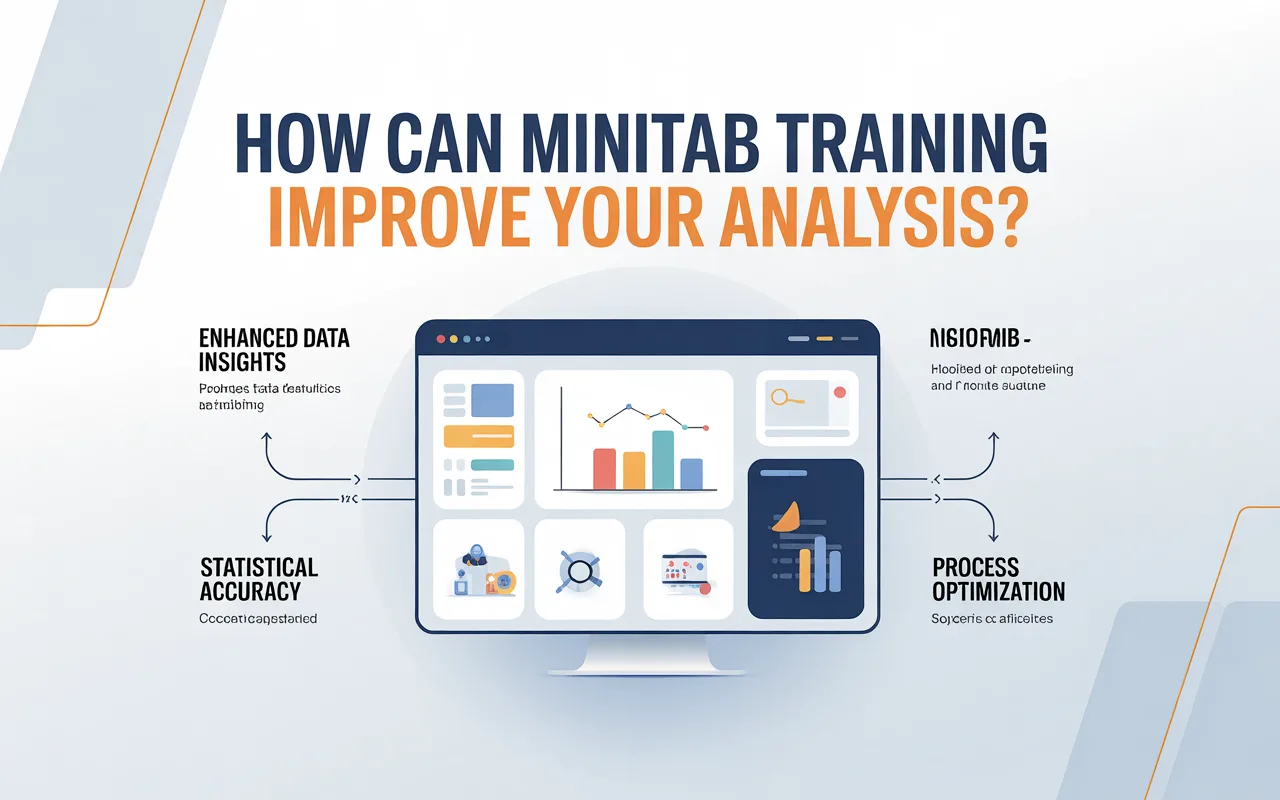
1. Enhancing Statistical Accuracy and Reliability
The most immediate way Minitab training improves your analysis is through the elimination of manual calculation errors.
Hard-Coded Formulas
Unlike traditional spreadsheets where a single misplaced parenthesis can ruin an entire dataset, Minitab’s statistical functions are hard-coded. Training teaches you how to input data correctly so the software can execute complex algorithms—such as Standard Deviation, Variance, and P-values—with 100% mathematical integrity.
Validating Assumptions
Reliable analysis depends on meeting certain statistical assumptions (like normality or equal variance). Minitab training provides the expertise to run Normality Tests before proceeding with deeper analysis. If your data isn't "normal," you learn how to apply transformations or choose non-parametric alternatives, ensuring your conclusions aren't built on a flawed foundation.
2. Streamlining the DMAIC Process in Six Sigma
For those in process improvement, Minitab training acts as the bridge between theory and execution within the Lean Six Sigma framework.
- Measurement System Analysis (MSA): Training teaches you how to use Gage R&R to determine if your measurement tool is actually capable of seeing the variation in your process.
- Root Cause Identification: You learn to move past correlation and prove causation using Regression Analysis and ANOVA (Analysis of Variance).
- Control Phase: Analysis is improved by learning to set up Statistical Process Control (SPC) charts that distinguish between "common cause" and "special cause" variation.
3. Sophisticated Visualization for Better Insight
"Analyzing" data is only half the battle; the other half is communicating those findings. Minitab training improves your analysis by giving you the tools to visualize complex relationships that are invisible in a table of numbers.
Multi-Vari Charts
One of the most powerful tools taught in advanced Minitab courses is the Multi-Vari Chart. This allows you to see multiple sources of variation simultaneously (e.g., variation within a batch, between batches, and over time) on a single visual.
Interactive Graphs
Modern Minitab training covers interactive brushing and linking. This means when you identify an outlier on a Scatterplot, you can immediately see the corresponding data points in your worksheet. This level of granular analysis allows you to investigate "bad data" or "process anomalies" with surgical precision.
4. Design of Experiments (DOE) Mastery
Perhaps the greatest leap in analytical capability comes through Design of Experiments (DOE). Most professionals use "One Factor at a Time" (OFAT) testing, which is slow and ignores how variables interact.
Minitab training empowers you to:
- Identify Interactions: Understand how Factor A and Factor B affect each other (e.g., how temperature and pressure together affect chemical yield).
- Optimize Settings: Use the Response Optimizer to find the "sweet spot" in a process where you get the highest quality at the lowest cost.
- Reduce Testing Costs: Learn to use fractional factorial designs to get the most information from the fewest number of runs.
5. Integrating Predictive Analytics and AI
As of 2026, Minitab has integrated advanced Predictive Analytics modules. Training in these areas allows you to move from "What happened?" to "What will happen?"
Predictive Modeling
Through training, you can utilize Classification and Regression Trees (CART). This is a form of machine learning that helps you identify the most important predictors of a specific outcome. For example, in a manufacturing setting, you can predict which machine settings are most likely to result in a defect before the production run even begins.
Automated Insights
Minitab’s Automated Machine Learning (AutoML) features help identify the best model for your data. Training ensures you understand the "Model Validation" metrics—like R-squared (pred) and AUC (Area Under the Curve)—so you can trust the machine's recommendations.
6. Improving Organizational Efficiency
Ultimately, Minitab training improves analysis by making it faster and more collaborative.
- Minitab Macros: Learn to automate repetitive analysis tasks, turning a three-hour reporting process into a three-second click.
- Project Sharing: Training on the Minitab Web App allows teams to collaborate on a single analysis file in real-time, ensuring "one version of the truth" across the organization.
- The Assistant Menu: Even for seasoned pros, the Assistant improves analysis by providing checklists that ensure no critical step in the statistical process is missed.
Conclusion
Minitab improves your analysis by providing a structured, scientifically valid approach to data. It transforms you from a "data reporter" into a "data scientist" capable of uncovering hidden patterns, predicting future trends, and driving measurable business results. In a world where everyone has data, those who have the training to analyze it correctly hold the competitive advantage.
Comparison Summary: Self-Taught vs. Professionally Trained
FeatureSelf-Taught UserProfessionally Trained UserStatistical ValidityGuess which test to use.Validates assumptions (Normality, etc.) first.Problem SolvingLimited to basic charts and means.Uses DOE and ANOVA to find interactions.EfficiencySpends hours cleaning data manually.Uses Minitab's data manipulation tools and macros.Predictive PowerLooks only at historical data.Uses CART and Predictive Analytics for forecasting.CommunicationStruggles to explain "why" to bosses.Uses Minitab Assistant reports for clear storytelling.