Understanding customer churn is crucial for any organization seeking to grow sustainably, particularly in today’s competitive financial landscape. Bank and credit union must gain insights into why and how many customers are leaving, and it is essential for accurate forecasting and long-term retention. But how you calculate customer churn rate can significantly impact the insights you draw. From basic formulas to advanced modeling, different methods serve different needs based on your customer base, growth stage, and available data.
This blog outlines three practical approaches to measuring churn: the simple churn rate, the average-based method, and predictive churn modeling. Each method provides a unique lens into customer behavior, enabling teams to make better-informed decisions. We'll also explore how AI-driven customer Insights take churn analysis a step further, transforming raw data into real-time insights that help financial institutions spot risk early and act before customers leave.
Key Methods to Calculate Customer Churn Rate
Method 1 – Simple Churn Rate Calculation
How It Works
The simple customer churn rate is a quick way to understand how many customers a business has lost over a specific time period. It uses a basic formula: divide the number of customers who left during that period by the number of customers at the beginning.
For example, if an organization started the month with 200 customers and 20 left, the churn rate would be 10%. This method focuses purely on the beginning of the period, making it easy to calculate and interpret.
When to Use It
This method is most effective and helps with customer retention strategies when the customer base is relatively stable and consistent over time. It’s well-suited for monthly reports or high-level summaries that give a clear view of short-term customer retention. However, when customer numbers fluctuate significantly, this method may not tell the whole story and can sometimes lead to over- or underestimation.
Method 2 – Average-Based Churn Rate
How It Works
The average-based customer churn rate considers both the starting and ending customer numbers. This provides a more comprehensive view of customer loss, particularly when those numbers fluctuate during the reporting period.
To find this rate, the number of customers lost is divided by the average number of customers over that period. For instance, if a company began the month with 300 customers and ended with 200, the average number of customers would be 250. Since 100 customers were lost, the churn rate would be 40%.
This method helps smooth out the effect of significant changes in customer count and provides a clearer picture of retention performance.
When to Use It
Average-based churn is ideal for businesses that are growing, contracting, or experiencing seasonal changes to predict customer churn. It is more useful than the simple method when customer volume isn’t steady, offering a clearer understanding of churn relative to the average customer base.
Method 3 – Predictive Churn Modeling
How It Works
Unlike the other two methods, predictive customer churn rate modeling is a forward-looking approach. It utilizes past customer trends and behavior patterns to estimate the likelihood of current customers leaving in the future. This approach helps companies not only measure churn but also take early steps to prevent it.
Instead of waiting to see how many customers leave, predictive modeling identifies warning signs and enables teams to act before churn occurs.
When to Use It
Predictive insights are valuable for organizations that are ready to move from tracking churn to actively reducing it. It works exceptionally well for businesses with established customer relationships and access to performance or engagement data.
This approach supports long-term retention by helping businesses understand which customers are most at risk and where to focus their attention. It’s an essential method for those who view customer retention as a strategic priority rather than just a metric to report.
How AI Analytics Makes Customer Churn Tracking Smarter
Why AI Is a Smarter Fit
AI helps organizations move beyond reactive churn tracking by analyzing customer behavior, usage trends, and engagement patterns to detect early signs of disengagement. This enables teams to take action before customers leave by having a clear idea about their customer churn rate.
Real-Time and Granular Insights
AI delivers detailed, real-time predictive retention insights by breaking down churn risk by customer segment, product usage, or timeframe. Instead of broad summaries, teams get precise, actionable data to guide timely interventions. This makes churn management more targeted, allowing for better retention strategies based on what customers are expected to do, not just what they’ve done.
How Lumify360 AI Analytics Helps Financial Institutions Retain More Customers
While churn formulas help measure customer churn rate and loss, true retention success comes from acting before customers leave. That’s where Lumify360 makes a difference.
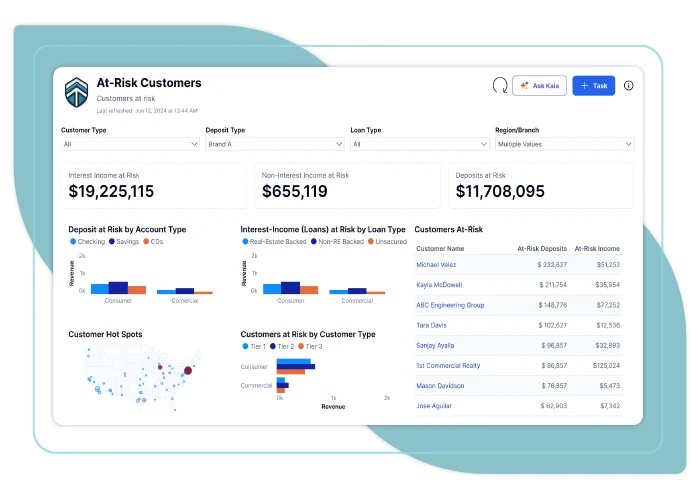
Designed for banks and credit unions, Lumify360 utilizes AI-powered analytics to transform raw customer data into actionable early warning signals. It integrates with over 200 customer touch points to track behavior, engagement trends, and transaction patterns, making it easier to spot at-risk customers and intervene promptly.
With predictive insights, customizable dashboards, and built-in tools like Kaia, Lumify360 helps teams personalize outreach and enhance retention strategies, such as identifying upsell and cross-sell opportunities, all while supporting long-term growth and fostering stronger customer relationships.