What Separates the Best BI Software From The Rest: A Technical Analysis
-
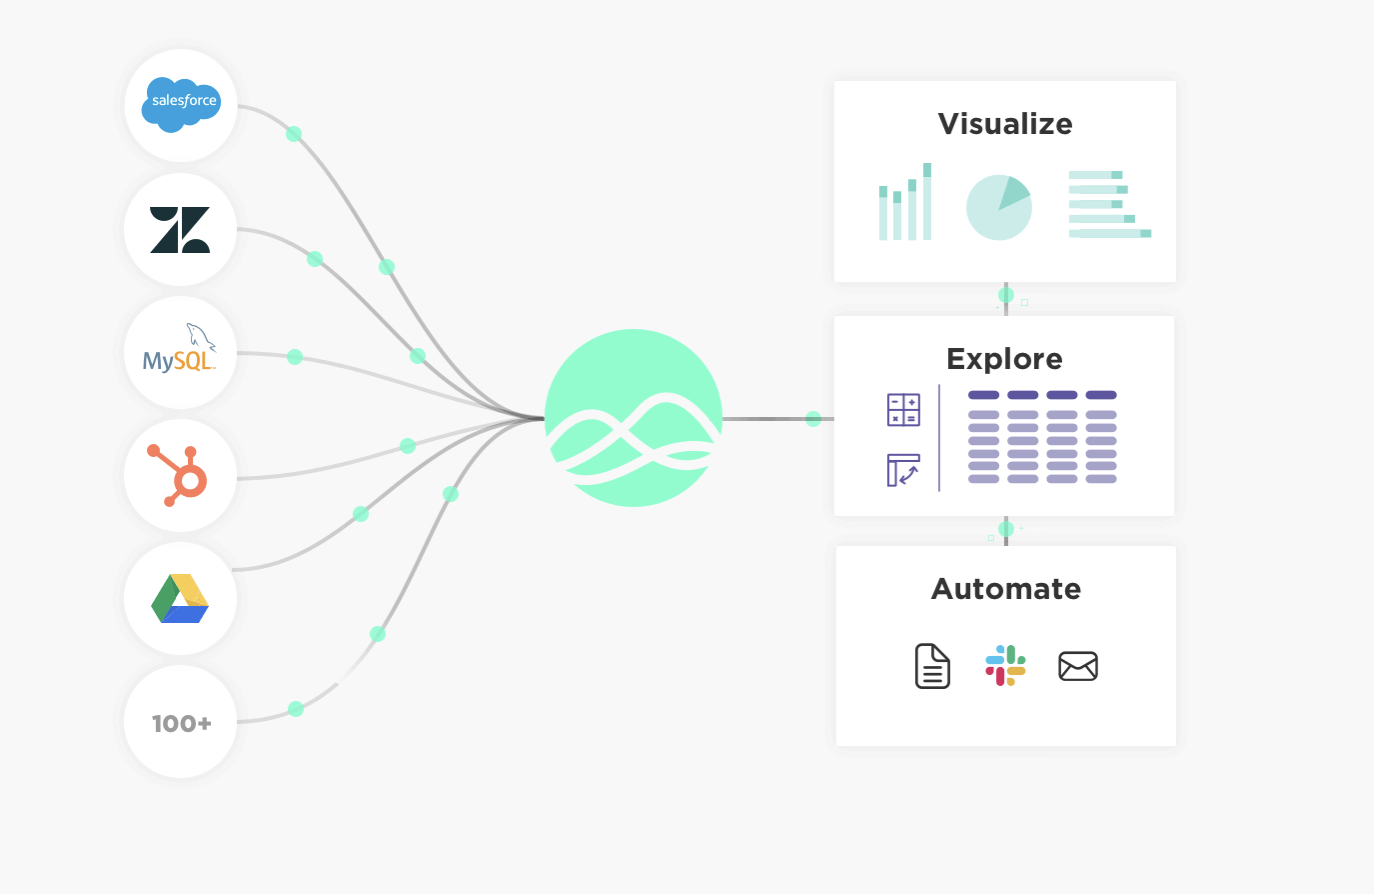
Data Source Compatibility
The ability of BI software to seamlessly integrate with diverse data sources is paramount. Businesses often have data scattered across multiple databases, cloud services, and APIs, making integration a critical feature. Seamless integration ensures that data from various sources can be consolidated, analyzed, and visualized efficiently, providing a unified view of business operations.
Without robust integration capabilities, organizations may face data silos, inconsistent data formats, and delays in data retrieval, which can hinder decision-making processes. Therefore, the best business intelligence software must offer extensive compatibility with various data sources to ensure a smooth data flow and accurate analytics.
Real-World Examples of Integration Challenges and Solutions Provided by Leading BI Tools
-
Challenge: Diverse Data Formats
Businesses frequently face the issue of integrating data from a variety of formats, such as SQL databases, NoSQL databases, and cloud storage. This diversity can complicate the data integration process, leading to inconsistencies and inefficiencies.
Solution with Grow BI: Grow BI offers over 100 pre-built connectors designed to seamlessly integrate with a wide array of data sources. This ensures that data import processes are smooth and efficient, regardless of the format. This capability is a key reason why Grow BI is considered among the best business intelligence software options available today.
-
Challenge: Real-Time Data Integration
For businesses that require the most current insights, integrating data in real-time is crucial. However, this process can be complex and resource-intensive, posing a significant challenge.
Solution with Grow BI: Utilizing advanced data streaming technologies, Grow BI facilitates real-time data integration. This continuous syncing capability ensures that users always have access to the most up-to-date information, a feature that sets apart the best dashboards software in the market.
-
Challenge: API Integration
Modern applications heavily rely on APIs for data exchange. However, integrating these APIs can be challenging due to varying standards and protocols, which can create compatibility issues.
Solution with Grow BI: Grow BI supports a comprehensive custom REST API integration, making it easy for businesses to connect their BI tools with other essential applications. This flexibility is particularly important in the UK, where diverse business environments demand adaptable and robust BI solutions. Grow BI’s capability to seamlessly integrate with various APIs highlights why it is considered among the leading BI software in the UK.
-
Advanced Analytics and Machine Learning Integration
To determine the probability of future outcomes given previous data, predictive analytics combine statistical algorithms, machine learning methods, and historical data. This branch of advanced analytics is crucial in Business Intelligence (BI) as it enables organizations to anticipate trends, understand potential risks, and make proactive decisions.
Predictive analytics helps businesses optimize operations, enhance customer experiences, and drive strategic planning. By forecasting future trends and behaviors, organizations can stay ahead of the competition, making predictive analytics a vital component of the best business intelligence software.
In order to provide actionable insights, top BI systems use a variety of predictive models. For instance, customer churn prediction models analyze past customer behaviors to identify those likely to leave, enabling preemptive retention strategies. For better inventory management and resource allocation, sales forecasting models use past sales data to foretell how sales will behave in the future. Risk management models assess past incidents to forecast potential future risks, allowing for proactive mitigation.
Machine learning (ML) algorithms empower Business Intelligence software to learn from data and improve over time without explicit programming. Commonly used ML algorithms in BI include regression analysis for predicting continuous outcomes, classification algorithms for categorizing data, clustering algorithms for grouping similar data points, and anomaly detection for identifying unusual patterns.
These algorithms enhance BI software’s analytical capabilities, enabling deeper insights and automation of complex data analysis tasks.
It provides significant advantages, such as automated insights that analyze data and generate reports without manual intervention. This capability saves time and resources while ensuring accurate and timely decision-making. Additionally, anomaly detection algorithms monitor data in real-time to identify outliers or unusual patterns, crucial for detecting fraud and ensuring quality control.
-
User-Friendly and Customizable Dashboards
Customizable dashboards are essential in Business Intelligence software as they cater to the unique needs of various user roles within an organization. Executives, analysts, and operational staff each require different views and insights to perform their duties effectively. Executives need high-level overviews with key performance indicators (KPIs) and strategic metrics, analysts require detailed, data-rich views that allow for in-depth analysis and trend identification, and operational staff benefit from real-time data and actionable insights specific to their daily tasks. Customizable dashboards ensure that each user receives relevant, actionable information tailored to their role, enhancing overall efficiency and decision-making.
Top BI tools offer extensive customization options, allowing users to create dashboards that meet their specific needs. Features such as drag-and-drop interfaces simplify the creation and modification of dashboards without requiring technical expertise. Widget customization enables users to add, remove, and configure widgets to display various data visualizations and metrics. Role-based access control allows organizations to set permissions, ensuring users can only access data relevant to their role. These features are essential for providing a user-friendly experience and ensuring that the best business intelligence software can adapt to any organization’s needs.
Grow BI excels in providing customizable dashboards that cater to different user roles. With its intuitive drag-and-drop interface, users can easily create and modify dashboards to display the most relevant information. Grow BI offers a wide range of widgets, including charts, graphs, and tables, which can be customized to show specific data points and metrics. Additionally, Grow BI’s role-based access control ensures that users only see the data pertinent to their role, maintaining data security and relevance. These features make Grow BI one of the best dashboards software, providing a tailored user experience that drives better decision-making.
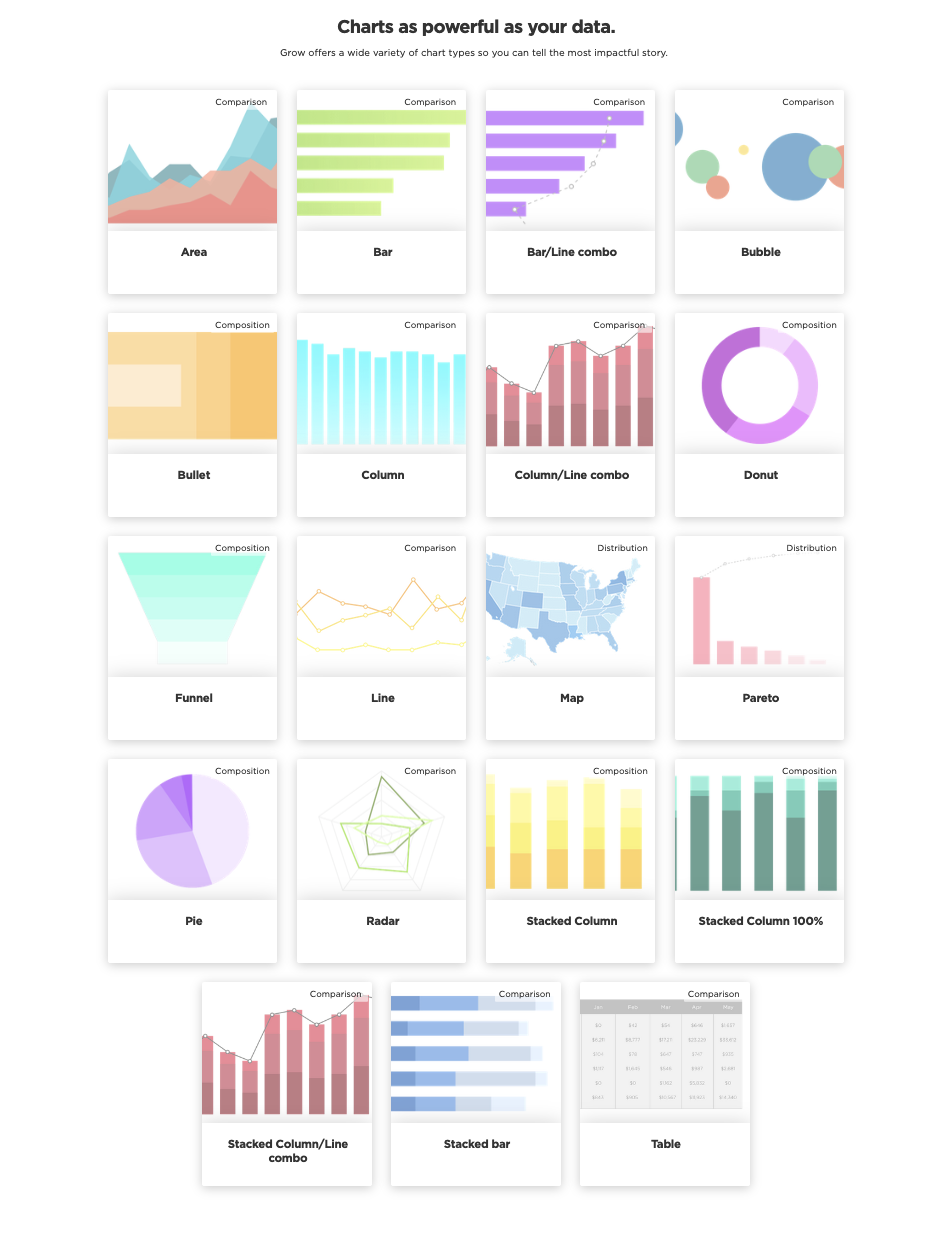
Interactive data visualization allows users to engage with data in a dynamic and intuitive manner. Unlike static charts and graphs, interactive visualizations enable users to explore data by drilling down into details, filtering information, and uncovering insights through direct interaction. The benefits of interactive data visualization include enhanced understanding, improved decision-making, and increased engagement. Interactive elements make it easier to grasp complex data by allowing users to explore different dimensions and perspectives. By visualizing data trends and patterns in real-time, users can make informed decisions quickly. Interactive visualizations keep users engaged and encourage deeper analysis.
Leading BI tools offer robust interactive visualization capabilities that set them apart from average solutions. Tableau is known for its advanced data visualization features and ease of use, enabling users to create highly interactive and customizable dashboards. Power BI offers strong integration with Microsoft products and provides a wide range of interactive visualizations and data exploration tools. Grow BI combines powerful interactive visualization tools with a user-friendly interface, making it accessible to users of all technical levels. These tools are recognized as some of the highly-rated BI software in the UK, providing businesses with the means to visualize and analyze their data effectively.
A notable case study that highlights Grow BI’s capabilities is the partnership with Altaworx. As the Director of Finance and Automation, Forrest Derr was tasked with creating customizable dashboards to track data efficiently. The level of customization required, combined with the ever-changing metric definitions, necessitated a robust solution. Grow BI enabled Derr to create up-to-date visualizations without extensive coding or costly updates. This led to significant improvements, such as cutting down on unpaid invoices by $40,000 in just 60 days and optimizing marketing strategies based on data insights. Additionally, the dashboards provided company-wide transparency by displaying data on TVs throughout the office, from conference rooms to director’s offices, enhancing collaboration and decision-making, demonstrating why Grow BI is considered as a preferred BI software in the UK.
User-friendly and customizable dashboards, combined with interactive data visualization, are critical components of the best business intelligence software. Grow BI stands out in this regard, offering extensive customization options and powerful interactive visualization tools that cater to various user roles. These features enhance decision-making, improve efficiency, and drive business success, making Grow BI the choicest BI software in the UK. By choosing Grow BI, organizations can benefit from the best dashboards software, tailored to their unique needs, ensuring high-quality leads and driving growth.
-
Scalability and Performance Optimization
Scaling Business Intelligence software to handle large datasets is a significant challenge for many organizations. Data grows dramatically in amount, diversity, and velocity as enterprises expand. This surge can strain BI systems, leading to slow query responses, longer load times, and overall reduced performance. Common challenges include data storage limitations, inefficient data processing, and difficulties in maintaining data integrity and accuracy.
Handling ever-increasing data volumes is no small feat, and innovative solutions are required to keep Business Intelligence software running smoothly and efficiently. One powerful approach is leveraging distributed computing frameworks like Hadoop and Spark. These frameworks allow BI tools to split large datasets across multiple nodes, significantly enhancing processing speed and efficiency. Another critical solution is in-memory processing, where data is stored and processed directly in memory rather than on slower disk drives. This approach dramatically reduces latency, ensuring rapid data retrieval and manipulation.
To further optimize performance, data partitioning is employed, which involves dividing large datasets into smaller, more manageable segments. This improves query performance and makes data management more efficient. Advanced data compression techniques also play a crucial role by reducing storage requirements and accelerating data retrieval speeds. Lastly, streamlined ETL (Extract, Transform, Load) processes are essential. These processes ensure that data is quickly and accurately prepared for analysis, minimizing delays and maintaining data integrity.
These cutting-edge technical solutions collectively empower BI tools to handle large data volumes with ease, maintaining performance and efficiency even as data grows exponentially. Superior Business Intelligence software, such as Grow BI, differ from the competition due to this strong methodology.
Grow BI excels in scalability and performance optimization by implementing these technical solutions. It uses distributed computing to handle large datasets efficiently, ensuring that data processing is quick and reliable. Grow BI’s in-memory processing capabilities allow for rapid data retrieval and analysis, minimizing latency. Data partitioning and compression techniques further enhance performance, enabling Grow BI to manage large volumes of data without compromising speed or accuracy. These features and unlimited user licences, make Grow BI one of the best BI tools, particularly for organizations dealing with substantial data growth.
Conclusion
The landscape of business intelligence software is vast and varied, but what truly sets a classic BI software apart from the rest is a blend of technical sophistication and user-centric design. The ability to handle large data volumes efficiently, offer customizable and interactive dashboards, integrate advanced analytics and machine learning, and maintain optimal performance metrics are the hallmarks of superior BI tools. Grow BI exemplifies these qualities, providing robust solutions that empower businesses to transform data into actionable insights seamlessly.
Grow BI’s advanced data integration capabilities ensure that organizations can handle diverse data sources with ease. Its predictive analytics and machine learning features offer deep insights, while the customizable and interactive dashboards cater to the specific needs of different user roles. Moreover, Grow BI’s scalability and performance optimization techniques make it a standout choice for businesses looking to manage large datasets without compromising on speed or accuracy.
For those seeking the top-rated Business Intelligence software, Grow BI offers a compelling solution. Its blend of innovative features and user-friendly design makes it one of the best dashboards software and the BI software in the UK and beyond. Don’t just take our word for it—experience the power of Grow BI yourself.
Sign up for a 14-day free trial and see how Grow can revolutionize your business intelligence strategy. Discover why so many businesses trust Grow by exploring “Grow Cost & Reviews on Capterra.”
Original Source: https://bit.ly/3WASxtL
