Retail Mobile App Data for Digital Shelf Analytics
Introduction
Consumer brands globally are increasingly realizing the critical importance of monitoring and enhancing their digital shelf Key Performance Indicators (KPIs), including Content Quality, Share of Search, and Availability. These metrics are pivotal in elevating eCommerce sales and securing a more significant online market share. With the growing demands of brands, the sophistication of leading Digital Shelf Analytics providers is also increasing. Consequently, adopting digital shelf solutions has become an indispensable prerequisite for today’s leading brands.
As brands and vendors continue to explore the realm of Digital Shelf Analytics, a significant and often underestimated aspect is analyzing digital shelf data on mobile apps. The capability of solution providers to efficiently track and analyze this mobile-specific data is crucial. In this context, incorporating retail mobile app scraping into the broader landscape of retail and digital shelf analytics is gaining prominence. The ability to scrape retail mobile app data becomes a strategic asset for brands and vendors looking to extract valuable insights and stay at the forefront of the competitive online market.
The Role of Retail Mobile App Data in Digital Shelf Analytics
The emphasis on mobile apps in today’s digital landscape is paramount, reflecting a shift in consumer behavior that cannot be overlooked. The battle for consumer attention no longer solely unfolds on desktop web platforms but extends to the palm of our hands—on mobile devices. A recent Insider Intelligence report underscores this trend’s significance, predicting that over 4 in 10 retail eCommerce dollars will be spent on mobile platforms for the first time.
The growth of delivery intermediaries like Instacart, DoorDash, and Uber Eats further propels the organic boost to shopping on mobile apps. According to eMarketer, US grocery delivery intermediary sales are expected to soar to $68.2 billion in 2025, a remarkable increase from $8.8 billion in 2019.
Mobile has become the form factor of choice for consumers, especially in the Consumer Packaged Goods (CPG) sector. A leading multinational CPG company disclosed that it witnesses up to 70% of its online sales from mobile apps. This staggering number underscores the fundamental change in consumer behavior, emphasizing the need for brands to adapt their digital shelf strategies accordingly.
Unveiling Variances in Digital Shelf Metrics Between Desktop and Mobile Apps
In digital shelf analytics, brands traditionally rely on data extracted from desktop sites of online marketplaces. The intricacies of reliving data from mobile apps have posed challenges, as conventional data aggregation systems designed for web applications are not readily adaptable to mobile platforms. Extracting data from mobile apps demands dedicated effort and exceptional technological expertise.
Recognizing the significant impact of mobile platforms, brands must prioritize tracking and optimizing their mobile digital shelf. Several digital shelf metrics exhibit notable variations between desktop sites and mobile apps, stemming from differences in user behavior across these two form factors.
A pivotal metric that profoundly influences a brand’s performance on retail mobile apps is its search discoverability. Loss of even a few ranks in search results can adversely affect an ecommerce team’s efforts. Testing this is simple – a search for “running shoes” on the Amazon website compared to its mobile app reveals differences in product listings among the top 20-25 ranks. Variances extend to the number and nature of sponsored listings, leading to significant distinctions in a brand’s Share of Search between desktop and mobile.
Share of Search, representing a brand’s product share among the top 20 ranked products in a category, is a crucial indicator of visibility on online marketplaces.
Consider a scenario where a brand heavily relies on desktop digital shelf data, presuming a robust Share of Search based on reports from its Digital Shelf Analytics partner. Unbeknownst to the team, the Share of Search on mobile is notably lower, negatively affecting sales.
We conducted an experiment using our proprietary data analysis and aggregation platform to gauge the extent of these differences. Focused on Amazon.com and its mobile app, we analyzed over 13,000 SKUs across diverse shopping categories to ensure a robust sample size.
Key Findings:
Variations in product listings among top-ranked results on Amazon.com and its mobile app.
Differences in the number and nature of sponsored listings affecting Share of Search.
There is potential for discrepancies between desktop and mobile digital shelf data, impacting brand visibility and sales.
Adapting to the nuances of both desktop and mobile platforms ensures a comprehensive understanding of digital shelf dynamics and optimizes brand performance across diverse online marketplaces.
Exploring Share of Search Disparities: A Comparative Analysis Between Digital Shelf on Apps and Desktop
Our investigation delved into three prominent consumer categories: Electronics, Consumer Packaged Goods (CPG), and Health & Beauty. The focus was on discerning patterns in Share of Search, particularly the disparities between the Amazon mobile app and desktop.
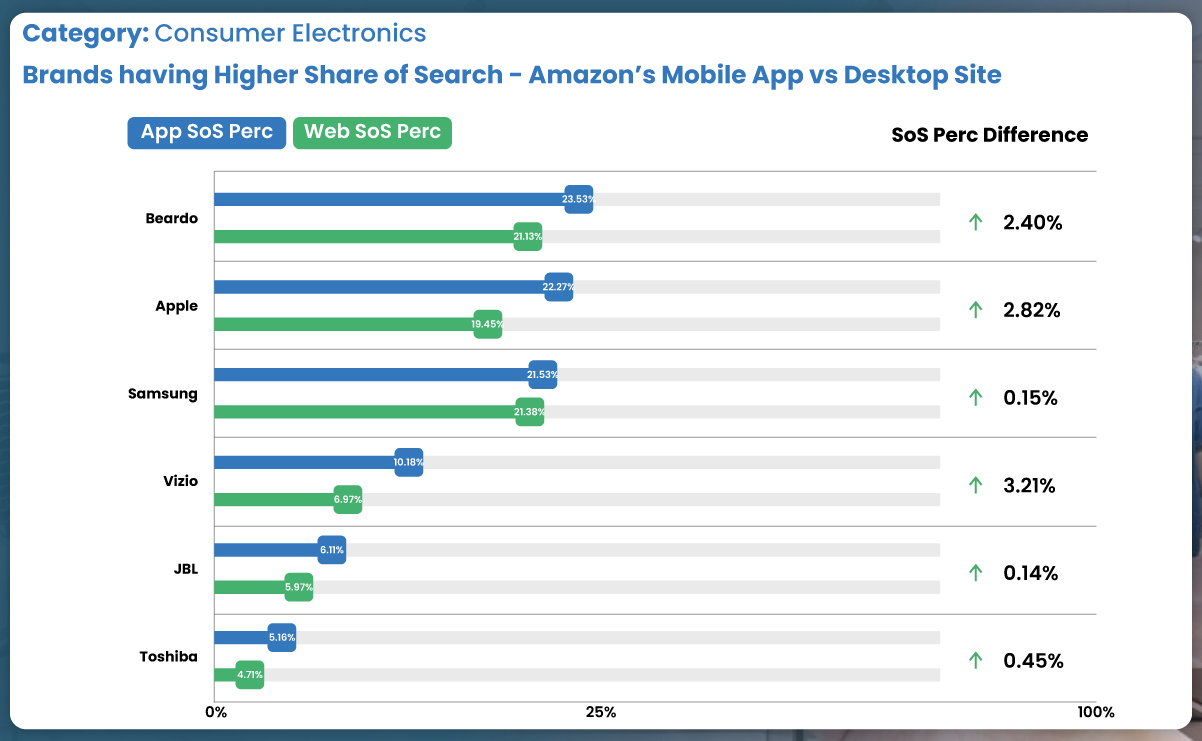
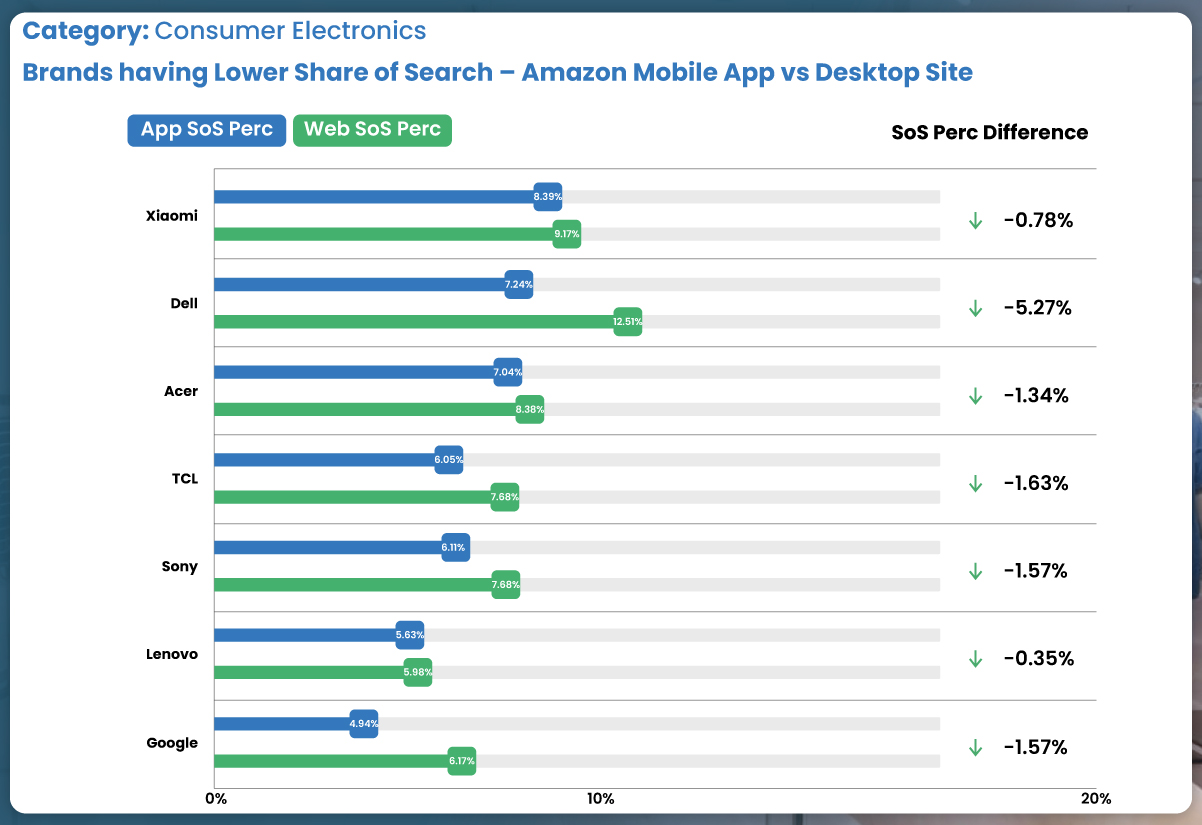
In electronics, renowned brands such as Apple, Samsung, and Motorola—recognized for their mobile phones, earbuds, headphones, and more—exhibit a markedly higher Share of Search on the Amazon mobile app than the desktop platform. This trend emphasizes the unique dynamics and consumer behavior variations between the app and desktop experiences within the electronics category.
Simultaneously, an intriguing pattern emerges when we shift our focus to laptop brands, including Dell, Lenovo, and Acer, along with other industry leaders like Google. These brands showcase a notably higher Share of Search on the desktop site than their app performance. This scenario underscores the critical importance for brands to carefully monitor and understand the nuances of Share of Search across different platforms within the electronics category.
This dynamic presents a challenge for brands. In cases where the Share of Search on mobile apps is lower, there exists a risk of overlooking potential corrective actions. The absence of essential data from their provider can hinder brands from promptly addressing and optimizing their digital shelf strategies. This highlights the significance of incorporating keywords such as “digital shelf analytics,” “retail analytics,” and “retail mobile app scraping” into brands’ analytical frameworks. By leveraging these insights, brands can proactively adapt and enhance their visibility across app and desktop platforms.
Within the Consumer Packaged Goods (CPG) category, distinctive patterns emerge as we analyze Share of Search dynamics. Notably, the Ramen brand Samyang, renowned for its popularity on TikTok and Instagram, exhibits a higher Share of Search on Amazon’s mobile app. This trend underlines the impact of social media presence on consumer behavior, particularly in the context of online search patterns.
Additionally, specialty brands such as 365 By Whole Foods and pasta and Italian food brands La Moderna, Divinia, and Bauducco showcase a significantly higher Share of Search on the app. These findings shed light on the unique digital shelf dynamics within the CPG category, emphasizing the varying impact of brand characteristics and marketing strategies on app-centric search behaviors.
-category.jpg)
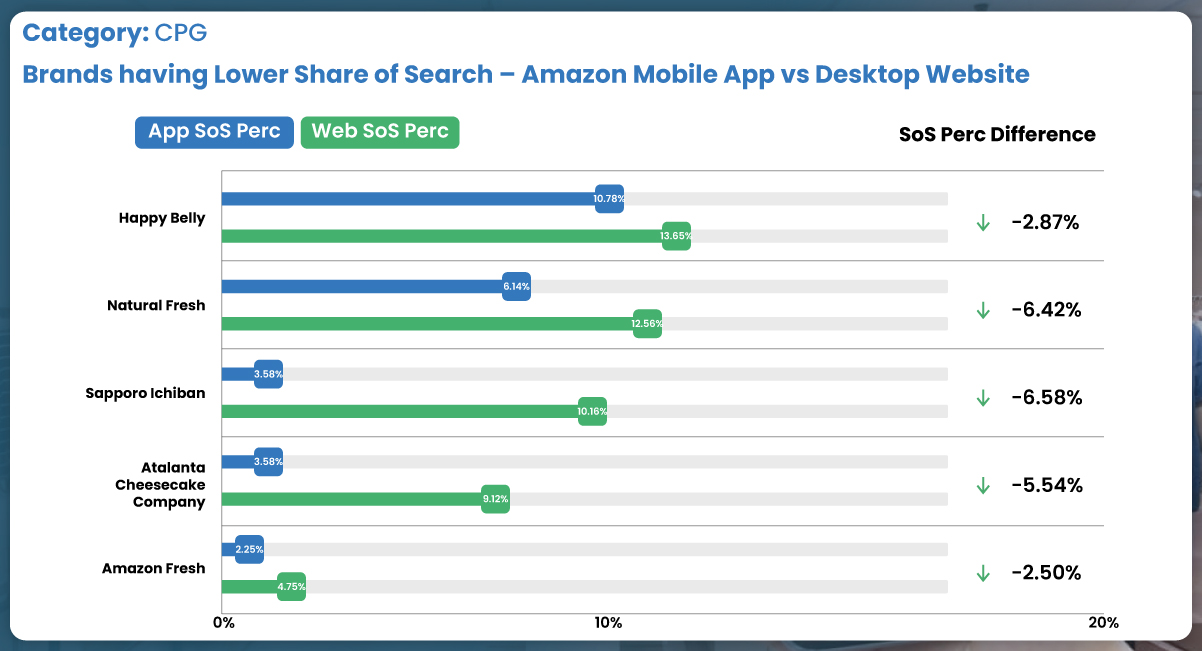
Within the realm of cheese and dessert brands, including notable names like Happy Belly and Atlanta Cheesecake Company, intriguing patterns emerge as we examine their Share of Search on Amazon’s mobile app. In contrast to other categories, these brands showcase a lower Share of Search on the app, indicating potential nuances in consumer search behavior within the Cheese and Dessert category.
Similarly, the Ramen brand Sapporo is more prominently discovered on Amazon’s desktop site, highlighting a platform-specific variation in the brand’s visibility.
A closer analysis reveals a substantial difference of more than 5% in the Share of Search for specific brands. This variance is poised to impact the mobile eCommerce sales levels and the overall performance of these brands significantly. Recognizing and addressing such disparities becomes crucial for brands aiming to optimize their digital shelf strategies and enhance their presence across diverse platforms.
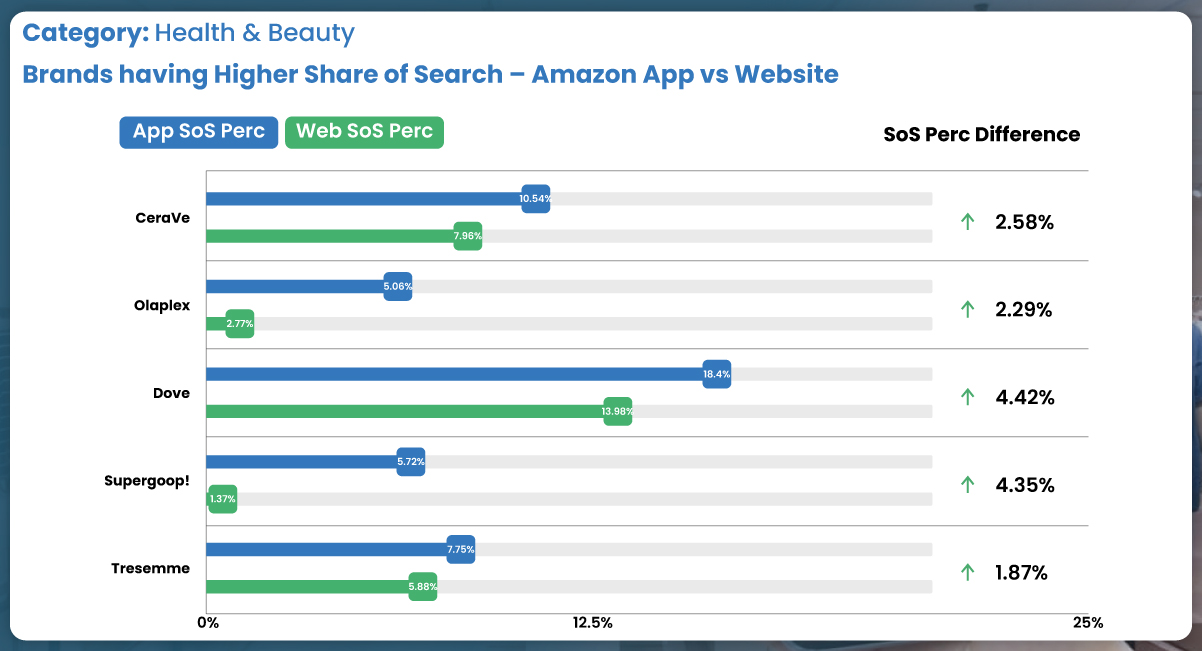
The Health & Beauty category reveals an interesting Share of Search dynamics, particularly within shampoos and hair care brands. Notable names such as Olaplex, Tresemme, and Dove present a higher Share of Search on Amazon’s mobile app than the desktop platform. This trend signifies the unique search patterns and preferences of consumers seeking health and beauty products, emphasizing the relevance of mobile app visibility for brands within this category.
Conversely, within the Health & Beauty category, our analysis reveals a distinctive Share of Search patterns among body care brands. Recognizable names such as Neutrogena and Hawaiian Tropic and the Beardcare brand Viking Revolution showcase a notably higher Share of Search on Amazon’s desktop site. This variation underscores the importance of recognizing platform-specific trends and tailoring digital shelf strategies to cater to diverse consumer search behaviors within the Health & Beauty sector.
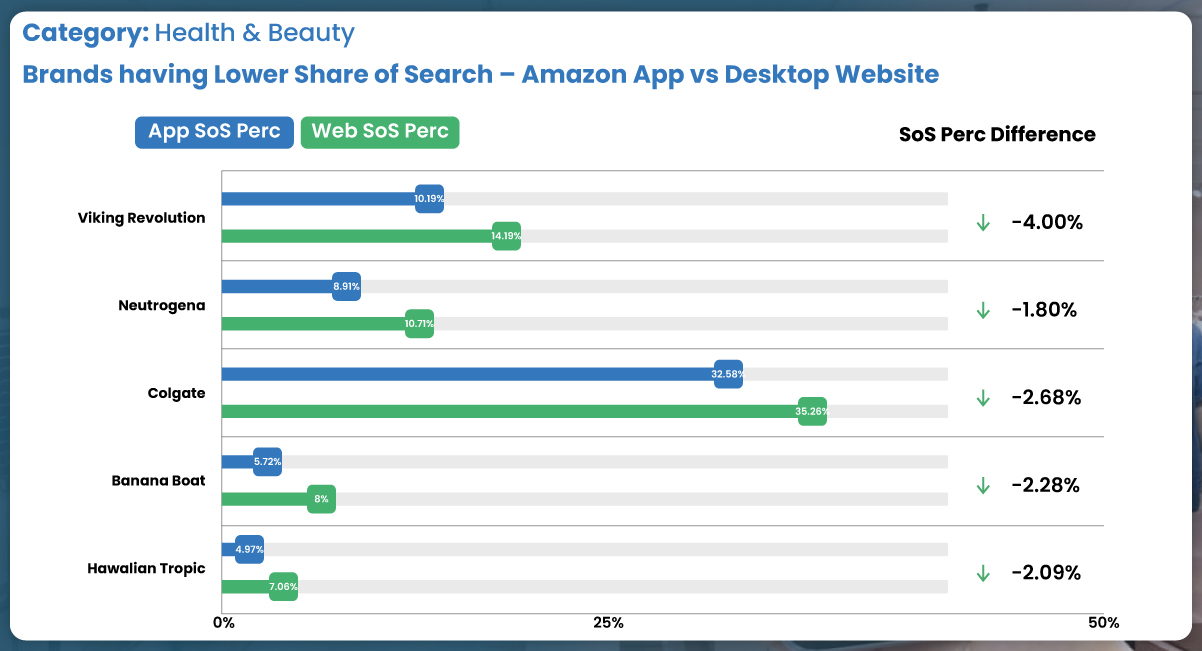
Our data analysis highlights numerous instances where brands showcase superior performance on either Amazon’s desktop sites or mobile apps. The distinctions observed in many cases are pronounced, underscoring the significance of recognizing and adapting to platform-specific dynamics within digital commerce.
Navigating Digital Shelf Disparities: Tailored Strategies for Mobile and Desktop Success
In light of our findings, it becomes evident that adopting a nuanced approach to digital shelf analytics is essential for brands. The substantial variations in Share of Search between mobile apps and desktop platforms conclusively highlight the need for more reliance on desktop data for digital shelf optimization.
For brands witnessing a lag in mobile digital shelf performance, strategic measures can be implemented to bolster their standing:
Strategic Retail Spend Reallocation: If a brand identifies a lower Share of Search on the mobile app, reallocating retail spending to the mobile platform becomes a proactive strategy. This inorganic compensation helps mitigate the short-term impact of lower discoverability, fostering optimized budget allocation and Return on Ad Spend (ROAS).
Optimizing Content for Mobile: Brands must ensure their content is tailored for the mobile form factor. This involves optimizing images for smaller screens and crafting succinct product titles emphasizing crucial attributes. This enhances click-through rates from mobile shoppers and gradually boosts organic Share of Search on mobile platforms.
CPG Optimization for Delivery Intermediary Apps: Specifically for Consumer Packaged Goods (CPG) brands, optimizing the digital shelf for delivery intermediary apps is imperative. With the flourishing ecosystem of grocery delivery platforms like DoorDash, Delivery Hero, Uber Eats, and Swiggy, leveraging Digital Shelf Analytics becomes pivotal. Brands can refer to our recently published whitepaper that intricately details how to enhance visibility and conversions on delivery apps.
However, the first step in this process is for brands to identify and collaborate with a Digital Shelf Analytics partner capable of capturing and analyzing mobile app data. This partnership facilitates tailored optimization approaches for all eCommerce platforms, ensuring a comprehensive strategy for success.
Actowiz Solutions: Your Partner in Comprehensive Digital Shelf Analytics
Actowiz Solutions takes the lead in providing the world’s most comprehensive and sophisticated digital shelf analytics solution. Surpassing other providers, our data aggregation platform accurately and reliably captures public data from mobile apps. This capability enables us to deliver our brand customers a holistic cross-device view of digital shelf Key Performance Indicators (KPIs).
Reach Out to Actowiz Solutions Today!
For brands seeking a robust digital shelf solution for mobile apps and web applications alike, Actowiz Solutions offers unparalleled expertise. Contact us today to explore how our digital shelf solutions can elevate your brand’s performance across diverse eCommerce platforms. You can also reach us for all your mobile app scraping, instant data scraper and web scraping service requirements.
tag : #RetailMobileAppData
#DigitalShelfAnalytics
#RetailMobileAppScraping
#RetailMobileAppScraper
#ScrapeRetailMobileApp

