Introduction:
In the dynamic world of financial markets, investors and traders alike seek effective tools to make informed decisions and maximize profits. One such tool that has gained widespread popularity is Technical Analysis. Rooted in the belief that historical price and volume data can predict future market movements, Technical Analysis is a powerful methodology used by traders to analyze and forecast trends. In this comprehensive guide, we will delve into the principles, methods, and key indicators that constitute Technical Analysis, empowering you to navigate the complex world of financial markets with confidence.
Understanding the Basics:
At its core, Technical Analysis is the study of historical price and volume data to identify patterns and trends that can aid in predicting future price movements. Unlike Fundamental Analysis, which evaluates a security\'s intrinsic value based on economic, financial, and qualitative factors, Technical Analysis focuses on market sentiment and the recurring patterns found in price charts.
Key Concepts in Technical Analysis:
Price Trends:
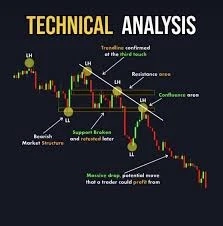
The foundation of Technical Analysis lies in recognizing and understanding price trends. Trends can be upward (bullish), downward (bearish), or sideways (neutral). Trend analysis helps traders make decisions based on the direction in which the market is moving.
Support and Resistance:
Support and resistance levels are crucial elements in Technical Analysis. Support is a price level where a security often stops falling, while resistance is a level where it often stops rising. Identifying these levels helps traders set entry and exit points.
Chart Patterns:
Technical analysts study various chart patterns to predict future price movements. Common patterns include head and shoulders, double tops and bottoms, triangles, and flags. Recognizing these patterns can provide valuable insights into potential trend reversals or continuations.
Indicators and Oscillators:
Moving Averages:
Moving averages smooth out price data to create a single flowing line. They help identify trends, providing a clearer picture of the market direction. Common types include simple moving averages (SMA) and exponential moving averages (EMA).
Relative Strength Index (RSI):
RSI is a momentum oscillator that measures the speed and change of price movements. It ranges from 0 to 100 and is used to identify overbought or oversold conditions. Traders often use RSI to confirm trend strength.
MACD (Moving Average Convergence Divergence):
MACD is a trend-following momentum indicator that shows the relationship between two moving averages of a security\'s price. It helps identify potential trend reversals and provides signals for buying or selling.
Bollinger Bands:
Bollinger Bands consist of a middle band being an N-period simple moving average and two outer bands being N standard deviations away from the middle band. These bands help identify volatility and potential reversal points.
Putting it into Practice:
Developing a Trading Plan:
Successful traders integrate Technical Analysis into a well-thought-out trading plan. This plan should include risk management strategies, entry and exit points, and clear criteria for when to execute trades.
Backtesting:
Before applying Technical Analysis in live markets, it\'s essential to backtest strategies using historical data. This allows traders to assess the effectiveness of their approach and make adjustments before risking real capital.
Continuous Learning:
Financial markets are dynamic, and successful traders stay ahead by continuously expanding their knowledge. Stay informed about new indicators, market trends, and evolving trading strategies.
Challenges and Criticisms:
While Technical Analysis has proven to be a valuable tool for many traders, it is not without its criticisms. Detractors argue that Technical Analysis is subjective, relying on historical data that may not accurately predict future market behavior. Additionally, critics point to the risk of overfitting, where analysts may find patterns that are not statistically significant.
Conclusion:
Technical Analysis is a powerful tool that, when used judiciously, can provide valuable insights into market trends and potential price movements. By understanding the key principles, concepts, and indicators, traders can make informed decisions and enhance their chances of success in the ever-evolving world of financial markets. Remember, mastering Technical Analysis is an ongoing process that requires dedication, continuous learning, and a disciplined approach to trading.


