


Chart patterns, which allow traders and investors to foresee possible market changes before they happen, are still considered one of the most powerful tools of technical analysis. The understanding of these graphics can very much enhance your trading decisions, be it the bigger formations that you are looking at or the candlestick chart patterns that you are analysing.
Chart Patterns: What Are They?
Technical analysts make use of chart patterns, which represent specific configurations formed by price fluctuations on the charts, to forecast the future prices. These patterns mirror the market psychology by expressing the ongoing battle between buyers and sellers.
As these patterns come about, they not only frequently signal potential trend changes or continuations but also offer traders practical insights.
The reliability of chart patterns in predicting the future price movements has frequently been proven in various financial markets. A case in point is the recent market scenario in January 2026, where the Nifty SmallCap 250 Index was in the process of making a "Death Cross" pattern – when the 50-day moving average dips below the 200-day moving average. This bearish signal influenced more than half of the stocks in the index, thus indicating the capacity of chart patterns to indicate early the direction of the entire market.
Categories of Chart Patterns
From a broad view of the chart patterns, they may be classified into three principal categories that, although having different functions in the field of technical analysis, are all equally important.
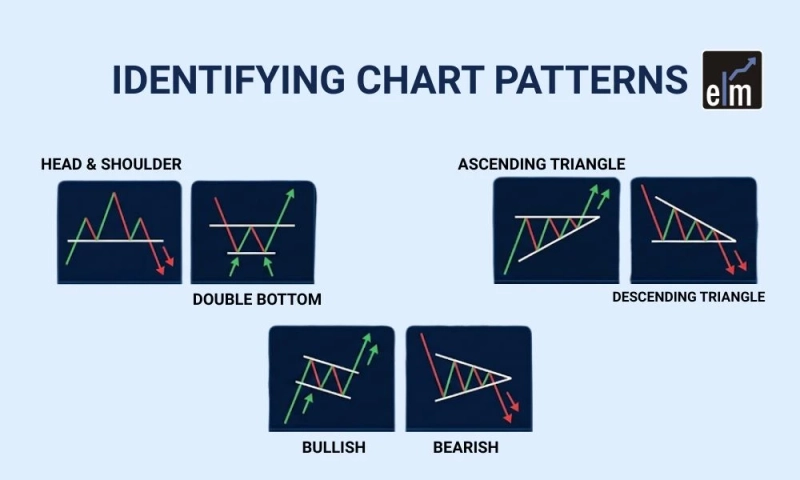
Reversal patterns signify the end of a current trend and the start of a new one in the opposite direction. Head and shoulders or tops and bottoms, as well as rising or falling wedges, are typical representations of such patterns. These patterns are very useful for traders wanting to enter at possible turning points. One example of this is that a hammer chart pattern was formed by IBM in August 2025, which the technical analyst saw as a potential indicator of nearing a bottom and possible trend reversal.
Continuation patterns indicate that the market is making a brief pause and then will continue in its major direction. The classic continuation patterns are the flags, pennants, and triangles. MTAR Technologies was an example of this in early 2026 when it broke out from a multi-month symmetrical triangle pattern with huge volume, thus confirming the continuation of its uptrend.
Bilateral patterns indicate great volatility and the possibility of movement either way. These patterns put traders on alert and require them to wait for a confirmation before entering the market.
Understanding Candlestick Patterns
Candlestick patterns are a specific subgroup of chart patterns that were developed in Japan in the 18th century. These candlestick chart patterns are an excellent source of information regarding market sentiment for selected timeframes. The four major price points – open, high, low and close are illustrated in each candlestick.
The individual candlestick patterns like hammers, shooting stars, and doji formations can indicate possible reversals. TCS created a bullish hammer in its monthly chart during May 2025, giving a hint of a bottoming-out process. The multi-candlestick patterns, like engulfing patterns or morning stars, often provide even stronger signals when a number of candles create a clearly recognizable formation.
Real-World Applications and Recent Examples
The use of chart patterns in real life has been and still is very profitable in today's market. Silver, for instance, at the beginning of January 2026, dropped very much after a bearish chart pattern emerged that scared the bulls. The same was the case with SBI stock, which in November 2025 broke out of a bullish flag pattern and later reached new peaks, thus confirming the pattern's predictive power.
The above cases from real life point out a very important rule: chart patterns are most effective when used with other technical indicators and fundamental analysis. Volume confirmation, moving averages, and market sentiment should all factor into trading decisions based on pattern recognition.
How to Use Chart Patterns Effectively
Successful pattern trading takes time and discipline. Traders should only decide after the pattern has fully formed, since entering too early can result in false signals. Another important factor in analyzing patterns is the volume, as the volume analysis is crucial here; changes in the volume often mean the pattern is more widely accepted by the market and hence more reliable than a low-volume pattern.
In trading, chart patterns and risk management are still paramount. For the protection of the capital while allowing the profitable trades to develop, traders can set appropriate stop-loss levels and position sizes according to the pattern height. It is also a common practice for traders to create a chart patterns PDF or reference guide where they keep their favourite setups with defined entry rules, exit strategies, and historical success rates.
Learning Resources and Continued Education
Besides, if the traders want to take their knowledge of chart patterns to a higher level, they can choose from a variety of resources. The brokers, as well as educational sites dedicated to finance, still very often provide their clients with downloadable chart patterns in PDF and guides that come with explanations of common formations and historical illustrations. These pictorial references can speed up the learning curve and act as a quick-reference tool in the course of the live trading.
Reading and understanding the theoretical concepts will only get you so far in mastering the patterns. You will need to put in the effort to observe the practical side of it. The creation of a feedback loop that gradually enhances your skills in recognising patterns is the result of the following series of activities: studying historical charts, detecting patterns in real time, and monitoring their outcomes.
Conclusion
Chart patterns and candlestick patterns have been and are still essential tools in the hands of technical traders navigating the complicated current markets. The death cross of the Nifty SmallCap 250 index is one of the many examples where these patterns have not lost their capability of showing the right market direction, as in the case of bullish breakouts in stocks such as MTAR Technologies.
Pattern understanding is already a skill in itself. Together with other technical indicators and strict risk management practices, traders can make their decision-making process better and possibly achieve higher trading outcomes.
The use of a complete chart patterns PDF or the study of live charts – mastering these patterns is always a good investment in your trading education.