In the fast-paced world of stock markets, identifying the right setups is key to capturing intraday opportunities. Candlestick patterns provide visual cues about market sentiment and potential price movements, making them essential tools for intraday traders. Understanding these formations helps you make informed decisions without relying solely on gut feeling.
1. Doji Candlestick
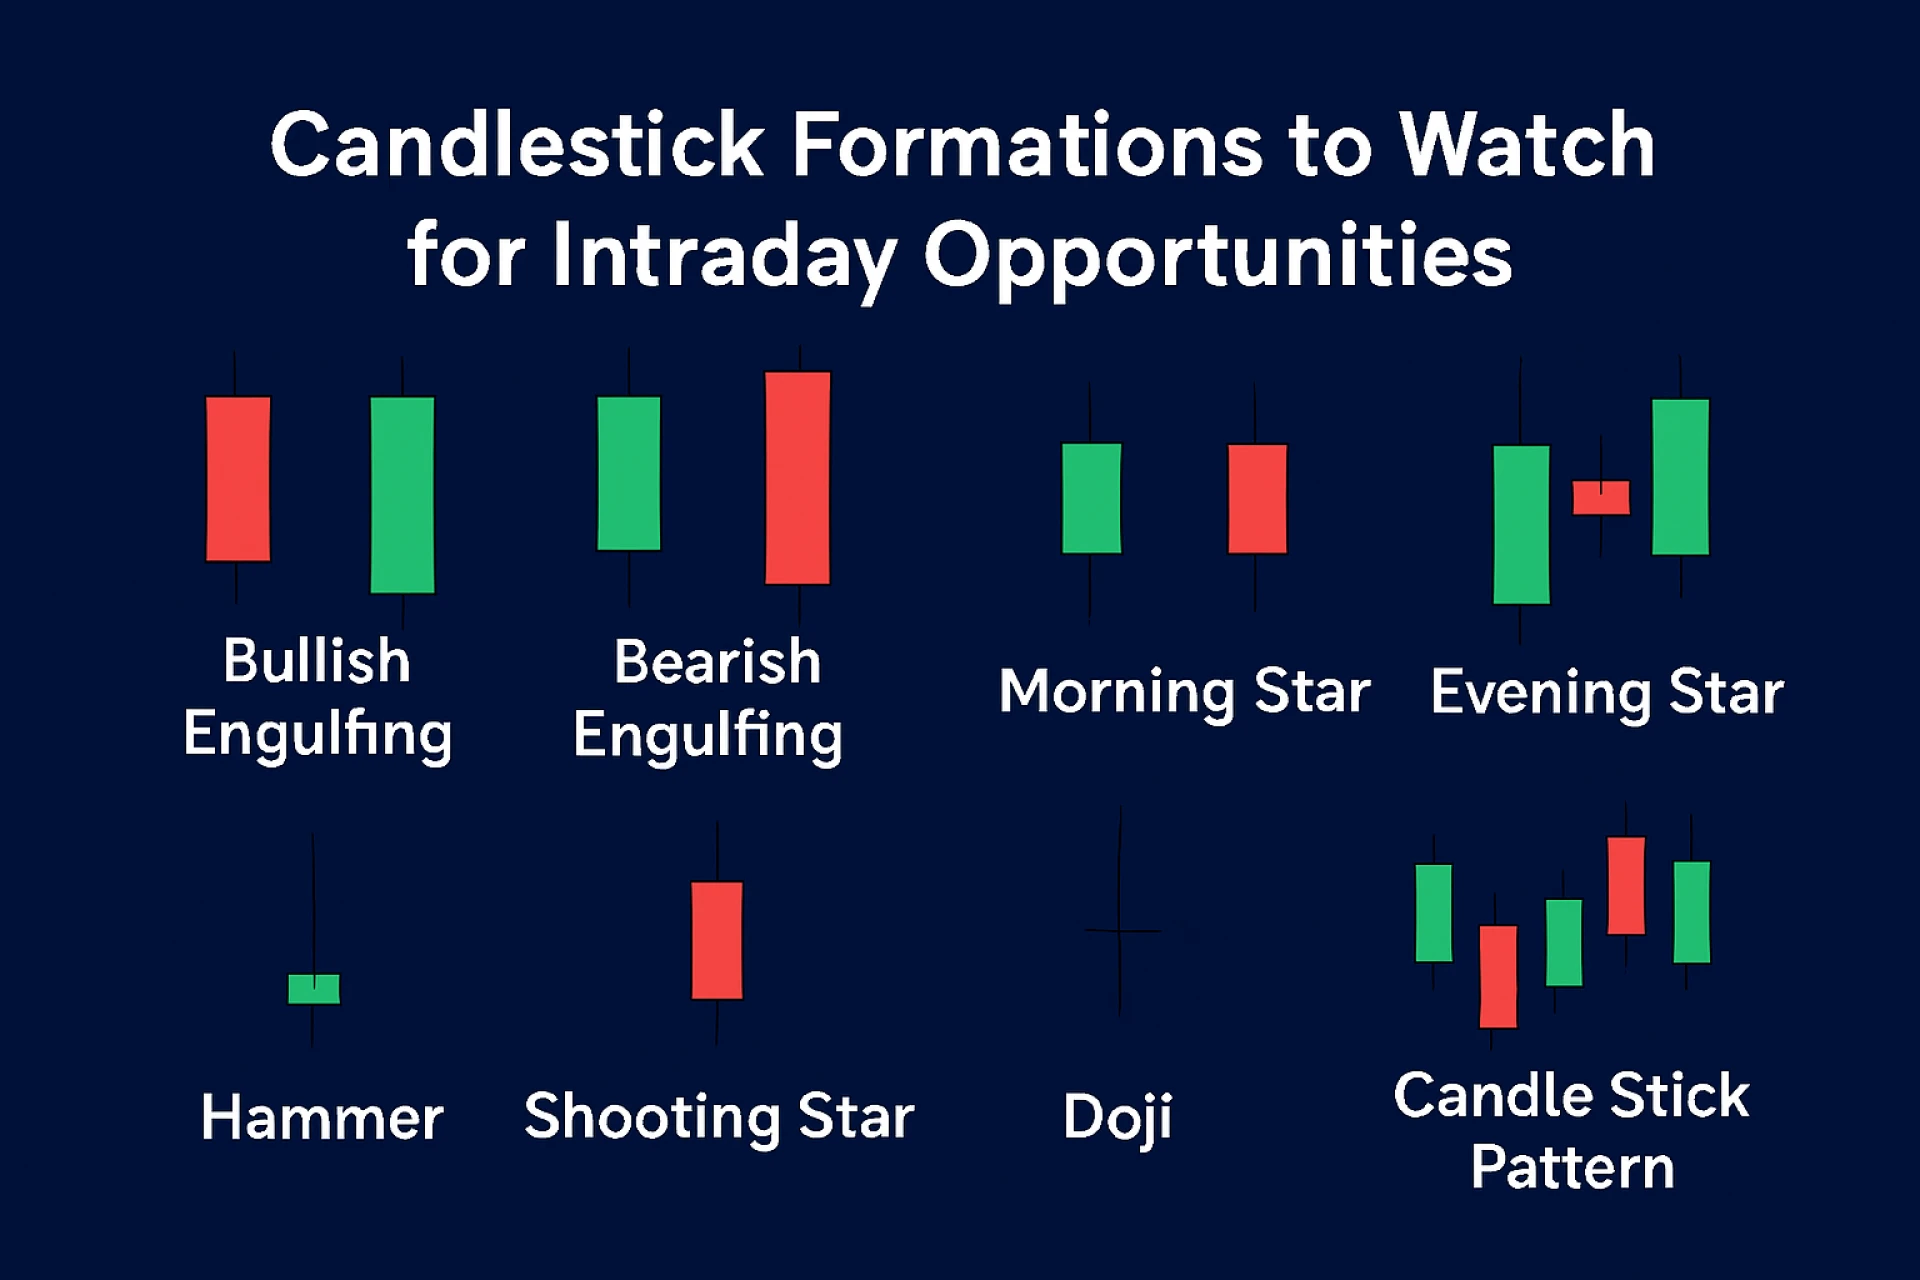
The Doji represents indecision in the market. It forms when the opening and closing prices are nearly equal, creating a small or non-existent body. For intraday traders, a Doji near support or resistance levels can signal a potential reversal. Observing this pattern alongside volume and momentum indicators enhances decision-making.
For more structured guidance on market timing, refer to Intraday Trading Tips.
2. Hammer and Hanging Man
Both the Hammer and Hanging Man have similar shapes but differ in context. A Hammer forms after a downtrend and may indicate a potential bullish reversal. Conversely, a Hanging Man appears after an uptrend and could suggest a bearish turn. These candlesticks are particularly useful for spotting intraday opportunities around key price levels and trendlines.
3. Engulfing Patterns
Bullish and Bearish Engulfing patterns show strong shifts in market sentiment. A Bullish Engulfing occurs when a small red candle is followed by a larger green candle, indicating buying pressure. A Bearish Engulfing is the opposite, highlighting selling strength. Traders can use these formations to anticipate short-term intraday moves, especially when combined with other technical signals.
4. Morning and Evening Stars
The Morning Star and Evening Star patterns are three-candle formations signalling potential trend reversals. A Morning Star suggests a possible upward move, while an Evening Star may indicate a downward shift. Identifying these patterns early in the trading day can provide actionable intraday opportunities for strategic entries.
5. Shooting Star and Inverted Hammer
The Shooting Star appears after a price rise and has a long upper wick, signaling that buyers tried but failed to sustain higher prices. The Inverted Hammer occurs after a downtrend and may hint at an upcoming rally. Observing these candlestick signals near resistance or support zones can help traders anticipate short-term market reactions.
6. Combining Candlestick Patterns with Other Tools
Candlestick patterns are more effective when used with volume, moving averages, and trend analysis. Confirming a reversal or continuation signal with supporting indicators increases the reliability of your trade setups. For detailed insights on integrating these tools, check Intraday Trading Tips.
Conclusion
Monitoring candlestick formations is a practical way to uncover intraday opportunities without overcomplicating your strategy. By combining these visual patterns with technical indicators, traders can identify potential entry and exit points efficiently. Regular observation and practice will help you read market behavior more confidently, creating a structured approach to intraday trading.