Understanding business data becomes more challenging as companies scale and collect more information. As raw data grows in volume and complexity, making sense of it without a clear visual representation becomes difficult for both analysts and decision-makers. One of the most effective ways to convert this complexity into clarity is through data visualization in business intelligence, which simplifies the communication of key insights and trends. Rather than sifting through endless spreadsheets or static reports, decision-makers now rely on visually rich dashboards and charts that highlight what matters most. This approach transforms numbers into clear narratives that drive confident, informed decisions. In this blog, we will discuss the benefits of utilizing data visualization in BI in detail.
Business Intelligence tools serve as the digital brain behind modern decision-making. They gather data from multiple sources, analyze it, and offer digestible summaries to key stakeholders. However, the raw output from these tools doesn’t always communicate the full story. That’s where visual interpretation plays a vital role.
Through data visualization in business intelligence, patterns hidden in raw figures become immediately noticeable. A line graph can reveal a declining trend in product sales. A heat map might point out operational inefficiencies. These visual cues prompt quicker analysis and deeper conversations within organizations. Instead of spending time decoding data, leaders can spend that time acting on it.
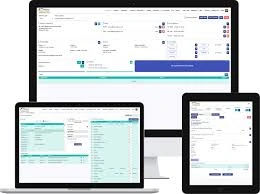
Using intuitive dashboards also allows teams across departments to stay on the same page. Everyone from finance to marketing can view the same data in formats they can understand, fostering collaboration and consistent interpretation.
Top 7 Benefits of Using Data Visualization in Business IntelligenceEffective data storytelling requires more than clean numbers; it demands clarity, speed, and relevance. Here’s how visualization improves BI efforts:
1. Quicker Decision-Making
Charts and graphs accelerate the time needed to process information. Executives can interpret a visual summary in seconds and make decisions without poring over lengthy spreadsheets. This agility keeps businesses responsive to market changes and customer behavior.
2. Easier Identification of Trends and Patterns
Seeing data in visual formats reveals shifts and anomalies that may go unnoticed in raw tables. Whether it’s rising customer acquisition costs or seasonal dips in traffic, visual dashboards spotlight changes before they turn into problems.
3. Improved Team Collaboration
Visual dashboards create a shared language for data. Departments no longer rely on separate interpretations. With data visualization in business intelligence, team members align more easily around goals, progress, and challenges, leading to coordinated actions.
4. Enhanced Communication with Stakeholders
Executives, clients, and investors often require concise insights, not exhaustive data dumps. Visual storytelling helps non-technical stakeholders understand metrics, supporting clear, confident presentations that win buy-in and trust.
5. Increased Productivity
When data becomes easier to read and interpret, teams spend less time extracting meaning and more time acting. BI dashboards allow for quicker status updates and regular performance checks without hours of manual reporting.
6. Real-Time Monitoring and Alerts
Many BI tools allow real-time tracking of business metrics. Visual alerts can notify teams about underperforming KPIs instantly. Whether it’s low website traffic or inventory issues, data visualization offers immediate visibility.
7. Smarter Forecasting and Strategic Planning
Visual historical data supports accurate predictions. Businesses can project future revenue, resource needs, or sales cycles by analyzing past patterns. This strategic view enables smarter planning backed by solid evidence.
Why Should You Choose Data Visualization Consulting?
Creating powerful visuals isn’t just about design — it requires strategy. Many businesses know their data has value but don’t know how to represent it in a way that makes it useful. That’s where data visualization consulting comes into play.
Consultants analyze your business goals, data sources, and audience needs to design visuals that make sense for your organization. They ensure that your dashboards serve their purpose rather than become digital clutter. With expert help, your BI tools don’t just collect data — they tell the story behind it.
Hiring professionals also helps avoid common mistakes like overcrowded dashboards or misleading charts. Visual elements need to be intuitive and tailored to the user, and this level of customization often requires experience.
A Role for BI Reporting and Visualization Services
When it comes to scaling BI capabilities, integrating a BI reporting and visualization service can be transformative. These services provide ongoing support, ensure consistency across dashboards, and introduce automation where manual reporting used to drain time.
Teams benefit from standardized reports that are both reliable and visually engaging. Over time, this consistency improves decision-making across all levels of the organization, as stakeholders grow comfortable reading and interpreting the same style of reports.
Data Visualisation Consultancy Adds Strategic Value
Another powerful option for companies seeking better insights is working with a data visualisation consultancy. Unlike standard software providers, consultancies bring a blend of business acumen and design expertise. They don’t just build dashboards — they identify the best way to visualize each data set for your goals.
They also support integration across platforms, connecting CRM, sales, and operations data into a unified visual ecosystem. This reduces data silos and helps companies gain a complete view of their performance.
SummaryVisuals unlock the full power of Business Intelligence. Instead of drowning in spreadsheets, businesses can see where they stand at a glance. Data visualization in business intelligence is not just a trend — it’s a fundamental shift in how decisions are made. With the right approach, visuals tell stories that data alone cannot.
Choosing expert support through data visualization services ensures your data works for you, not against you. Even more, partnering with a data visualization firm can turn your dashboards into growth engines. As businesses compete in increasingly data-heavy environments, those who invest in smarter, more strategic ways to interpret their information will lead the way forward.